Hi dear community,
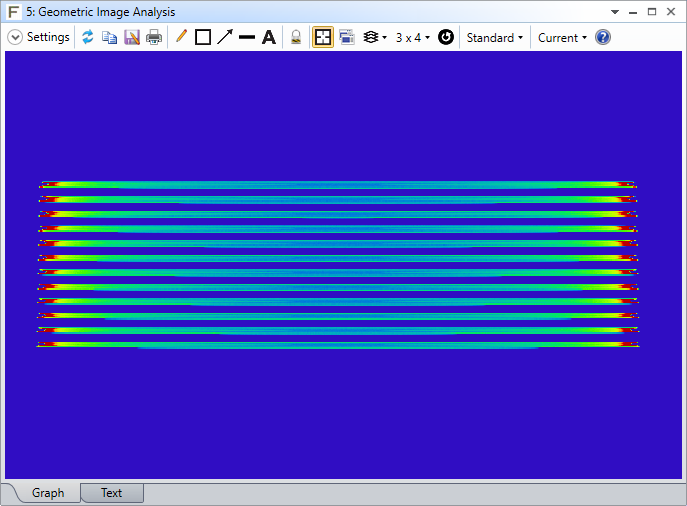
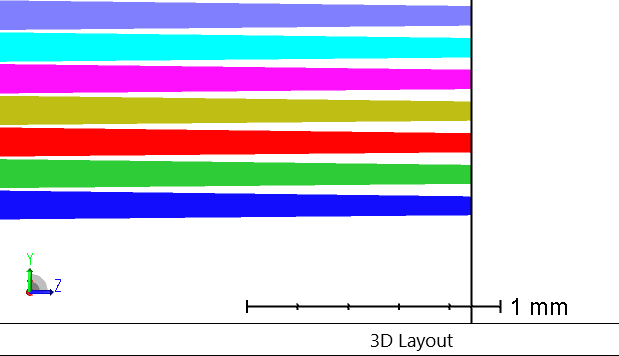
my question is about analysing the data resulting from a footprint diagram with different configurations and wavelengths. I have created an optical setup in sequential mode that includes a diffraction grating in order to separate wavelengths in the C-band. I use an “Object Space NA” aperture with a VCX vignetting factor to describe my input source, and the 24 separated wavelengths from two configurations are shown using the footprint diagram.

I would like to use the data provided by the diagram in order to evaluate the crosstalk of the wavelengths, while performing a tolerance study of the setup by varying parameters at the Lens Data Editor.
I understand that there are some limitations following this approach with ray tracing. Is it possible to exploit the diagram in such way to measure the crosstalk of the wavelengths? Or do I have to use a different approach with a different source to solve my problem, for example using illumination and a detector in non-sequential mode? (I haven’t studied NSC so much yet). I also attach my file here.
Any help is much appreciated and thank you very much in advance.
Kind regards,
George


