Solved

Getting the Ray Spot diagram/Seidel Aberrations from interferometer data

  • March 23, 2025
  • 1 reply
  • 54 views

Diptayan

Hi Everyone,

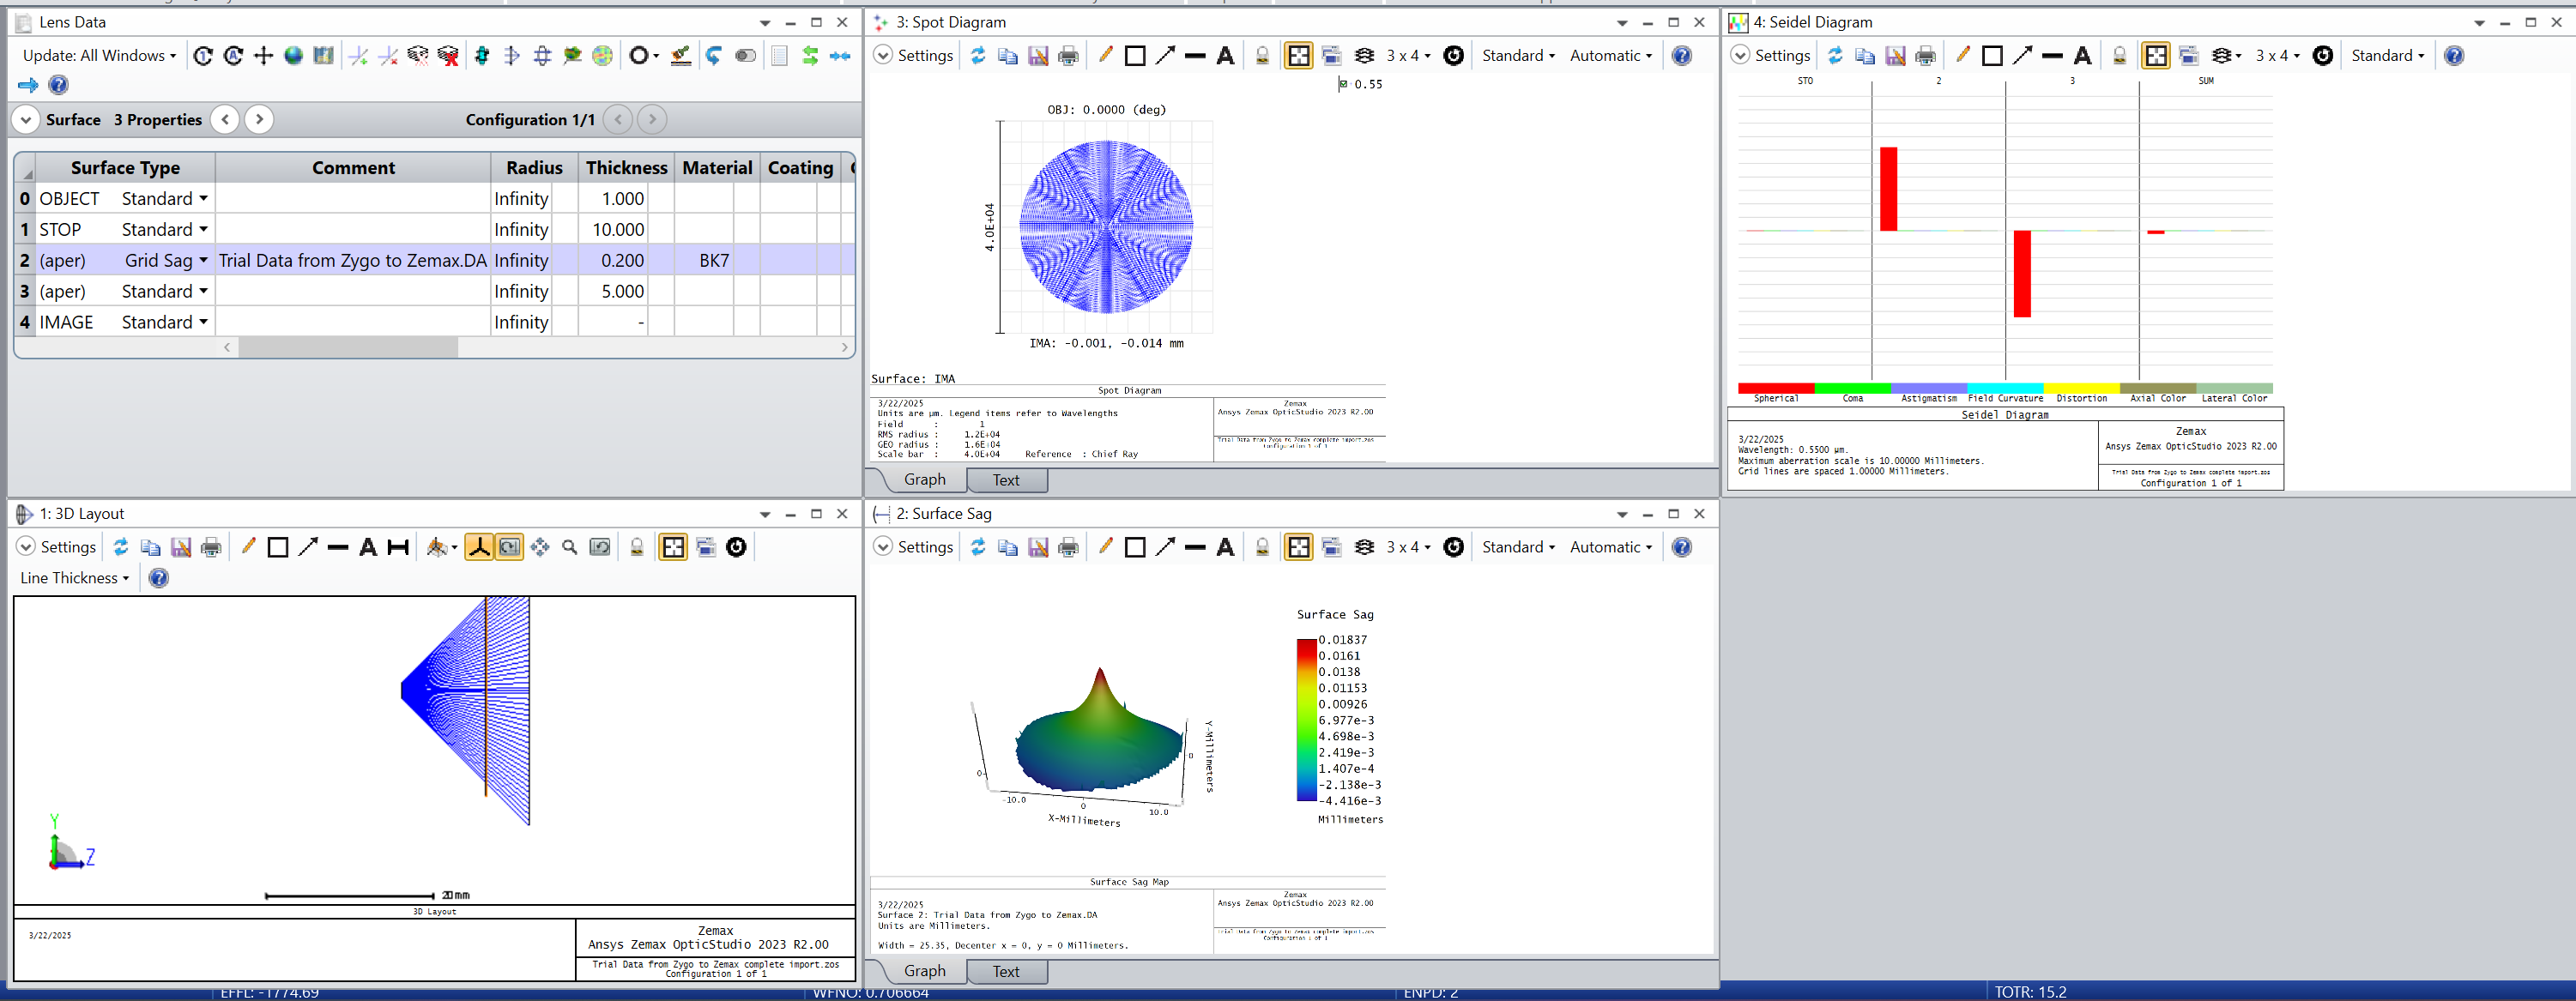
I am trying to get the seidel aberrations and ray spot diagram for a surface of which I have only the interferometric data (captured by a zygo white light interferometer and processed in their MX software). I think I have successfully imported the data from the interferometer’s software to Zemax as the peak to valley sort of matches. But I am seeing no difference in the ray spot size and seidel aberrations. I am uploading the link to the files as it is a big one (both Zemax and interferometric data). Kindly help me or suggest what the issue is.


Zemax File


Thank you.


Best answer by Rishab

The pupil plane should be matched to the grid sag surface, so consider making it as the stop. 

View original
Did this topic help you find an answer to your question?

1 reply

Rishab
  • Single Emitter
  • 1 reply
  • Answer
  • March 25, 2025

The pupil plane should be matched to the grid sag surface, so consider making it as the stop. 


Reply


Cookie policy

We use cookies to enhance and personalize your experience. If you accept you agree to our full cookie policy. Learn more about our cookies.

 
Cookie settings