Hi Everyone,
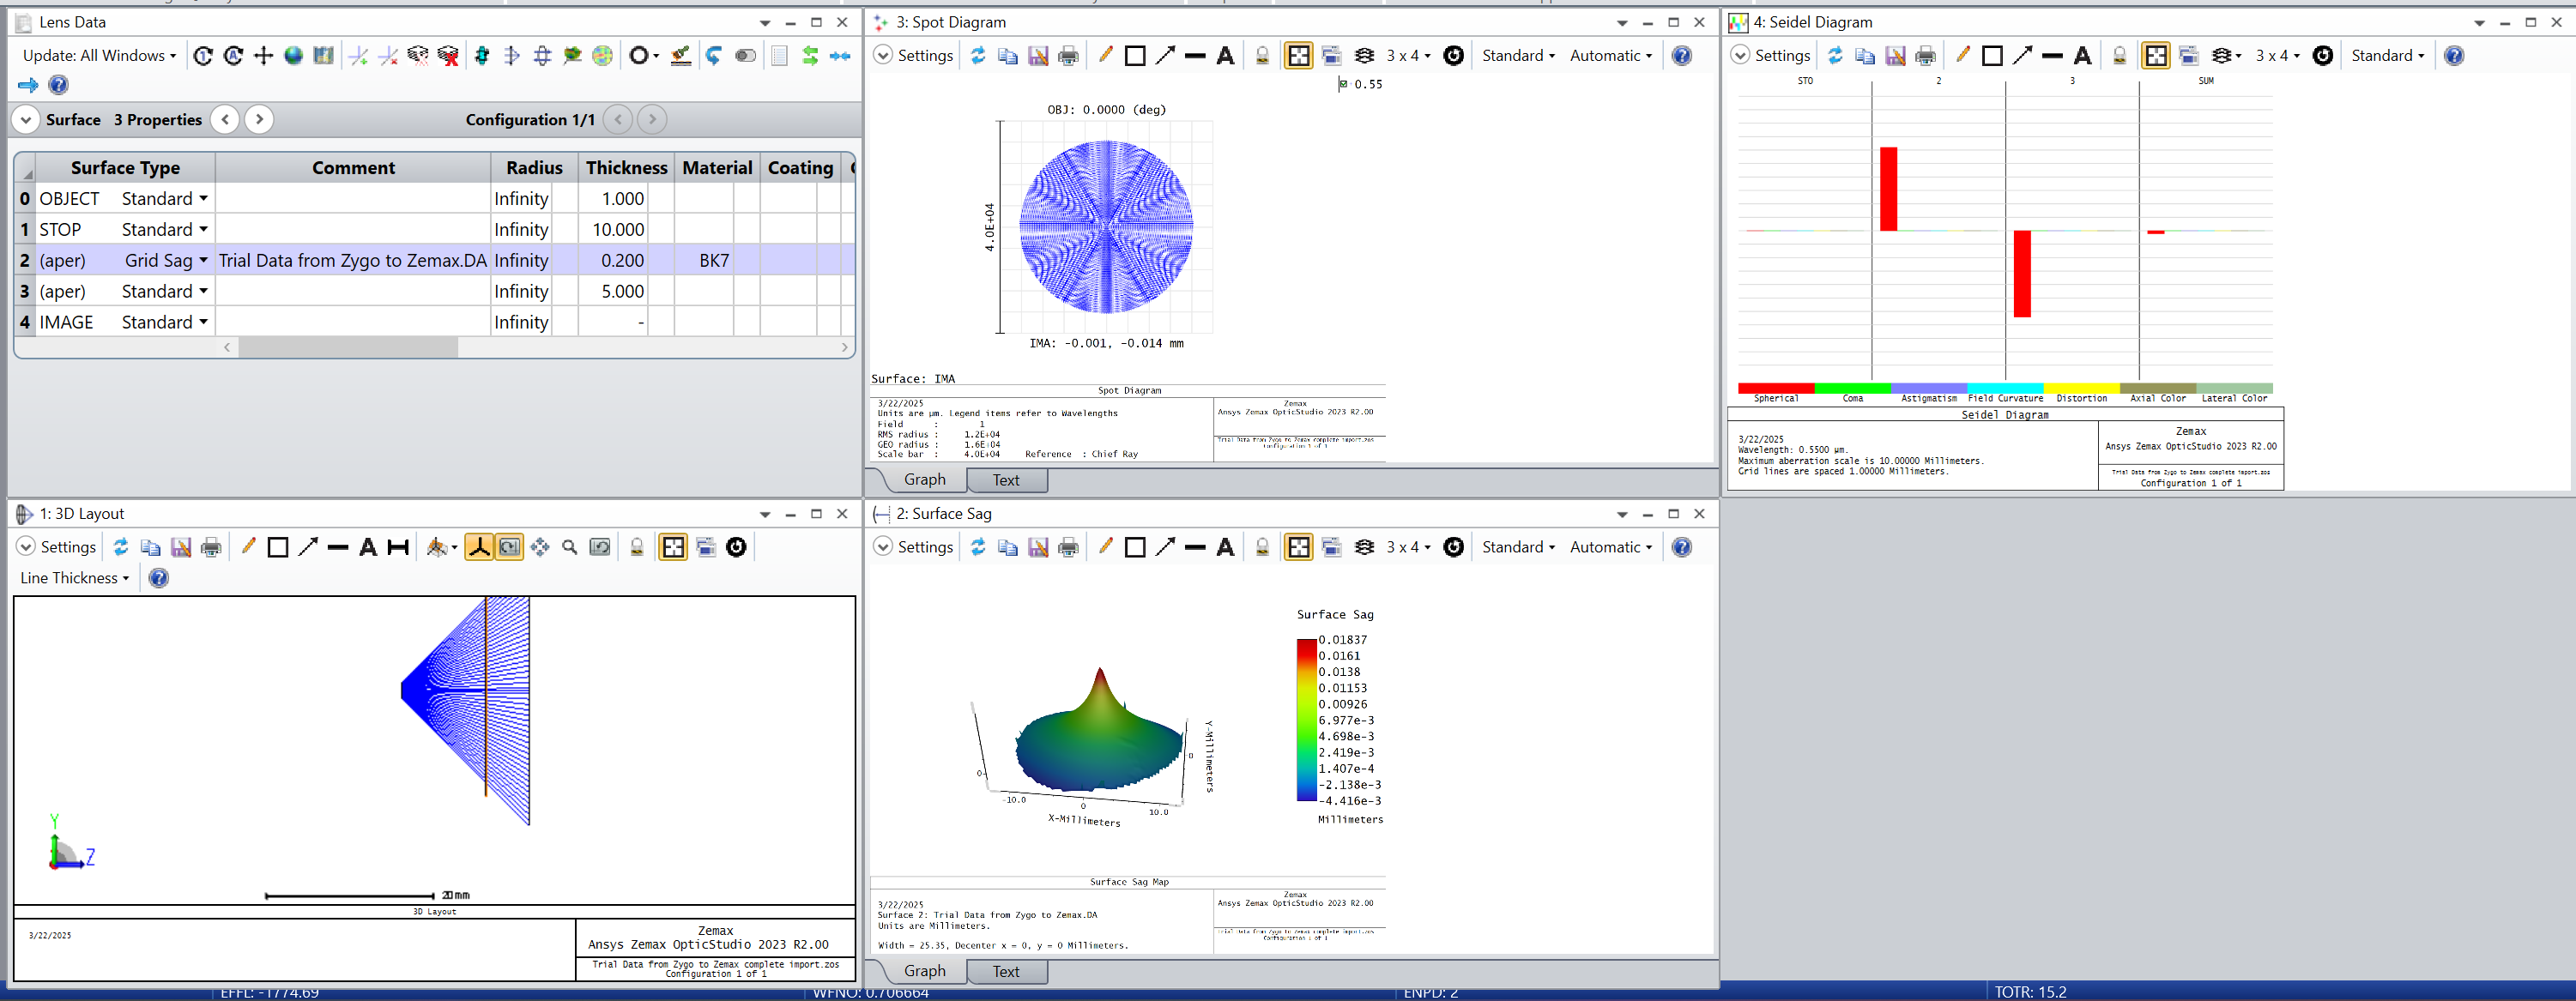
I am trying to get the seidel aberrations and ray spot diagram for a surface of which I have only the interferometric data (captured by a zygo white light interferometer and processed in their MX software). I think I have successfully imported the data from the interferometer’s software to Zemax as the peak to valley sort of matches. But I am seeing no difference in the ray spot size and seidel aberrations. I am uploading the link to the files as it is a big one (both Zemax and interferometric data). Kindly help me or suggest what the issue is.
Thank you.


