Generally speaking the FCGS and FCGT values are more robust compared with the analysis window.
It's mentioned in The Analyze Tab (sequential ui mode) > Image Quality Group > Aberrations (Image Quality Group) > Field Curvature and Distortion :
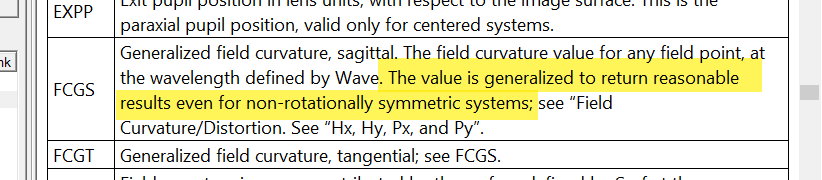
Strictly speaking, the field curvature and distortion plots are only valid for rotationally symmetric systems with plane object and image surfaces. However, OpticStudio uses a generalization of the field curvature and distortion concepts to give reasonable results for some, but not all, non-rotationally symmetric systems. Caution should be used when interpreting these data for non-rotationally symmetric systems or systems with object and/or image surfaces that are not planes.
FCGS and FCGT have more reasonable results for non-rotationally symmetric systems.
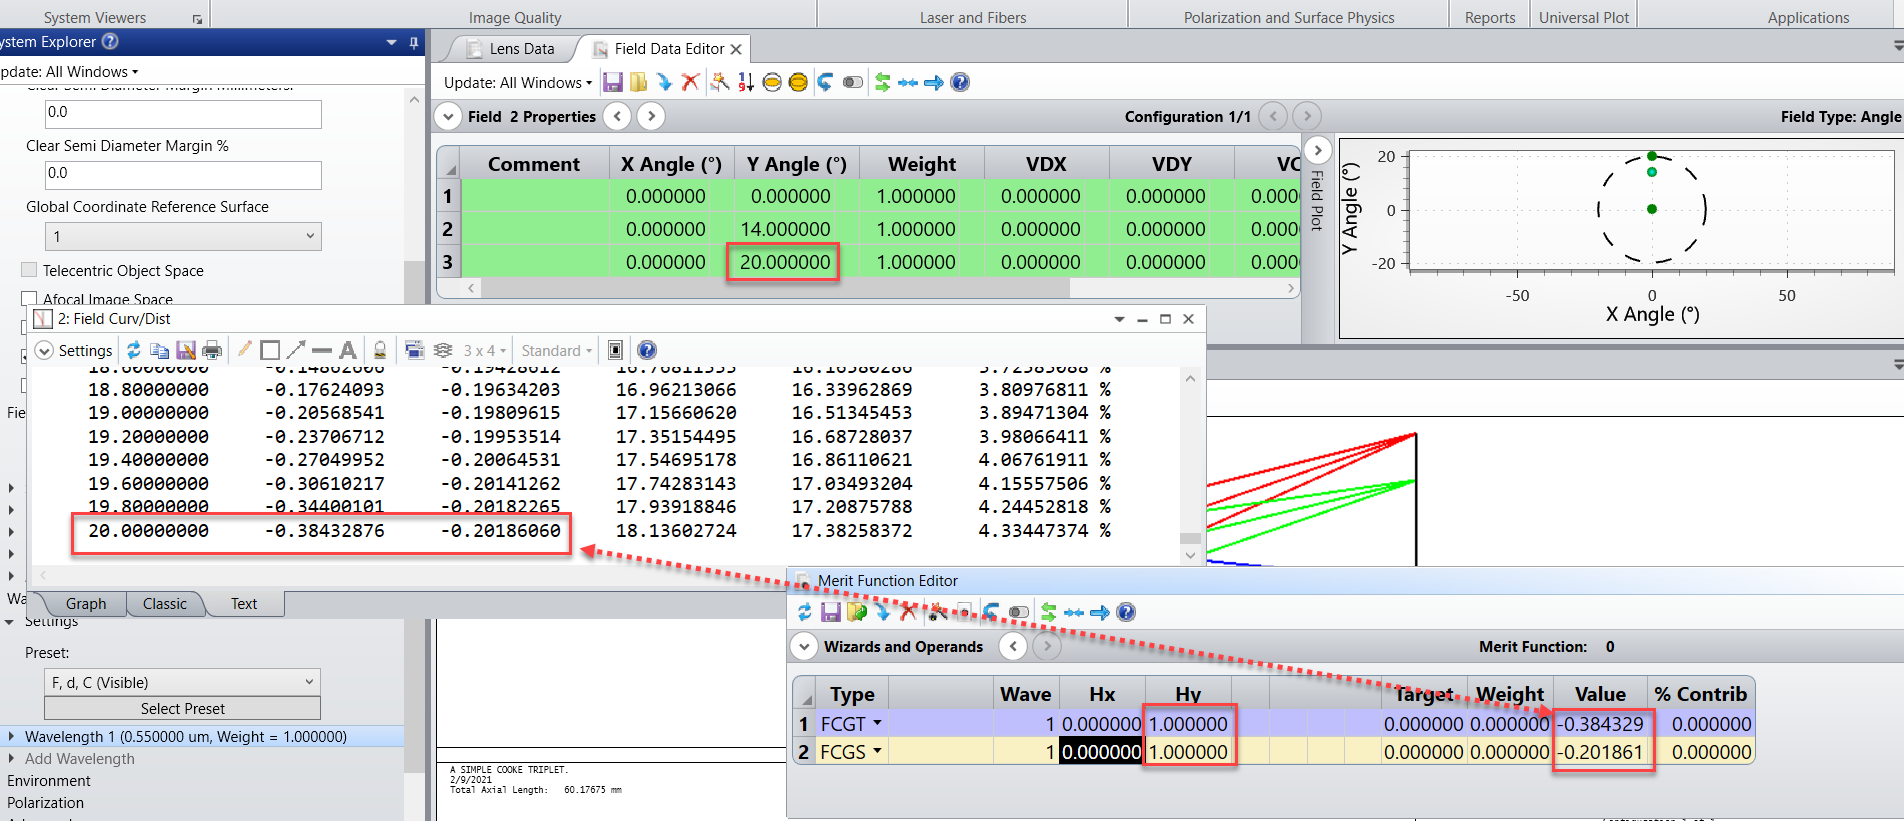
If the system is rotationally symmetric, the Field curvature values reported by the FCGT and FCGS operands should match those values listed in the Field Curv/Distortion plot, for the same field position and for the same wavelength. With our sample file Cooke triplet. If i look at the field #3 20 degrees, which has Hx=0, Hy=1, i can match the values perfectly between the Field Curv/Distortion plot and the FCGT and FCGS operands, as shown below.