How Zemax represents values to calculate Yield information? For example, I need to draw it by my own criteria which the smaller than worse and we need to show percent of systems than smaller it takes than percent of systems become higher.

Solved
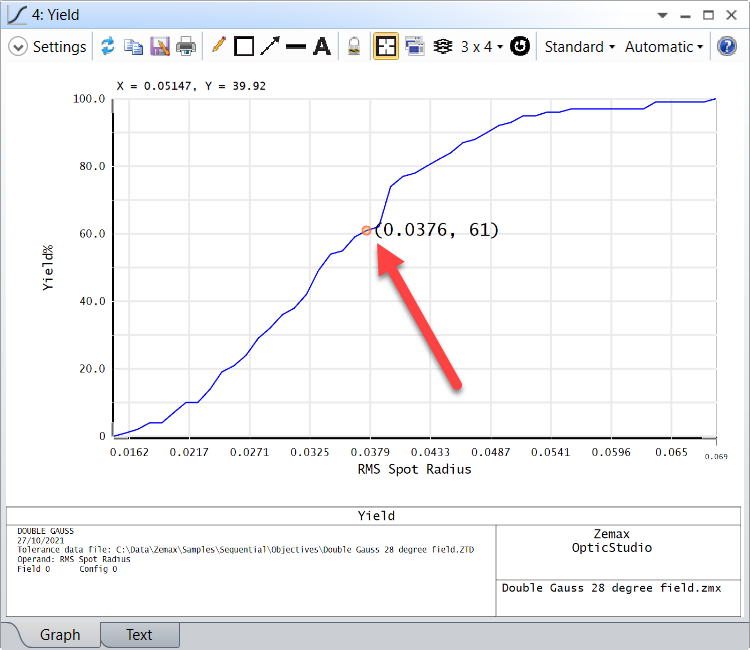
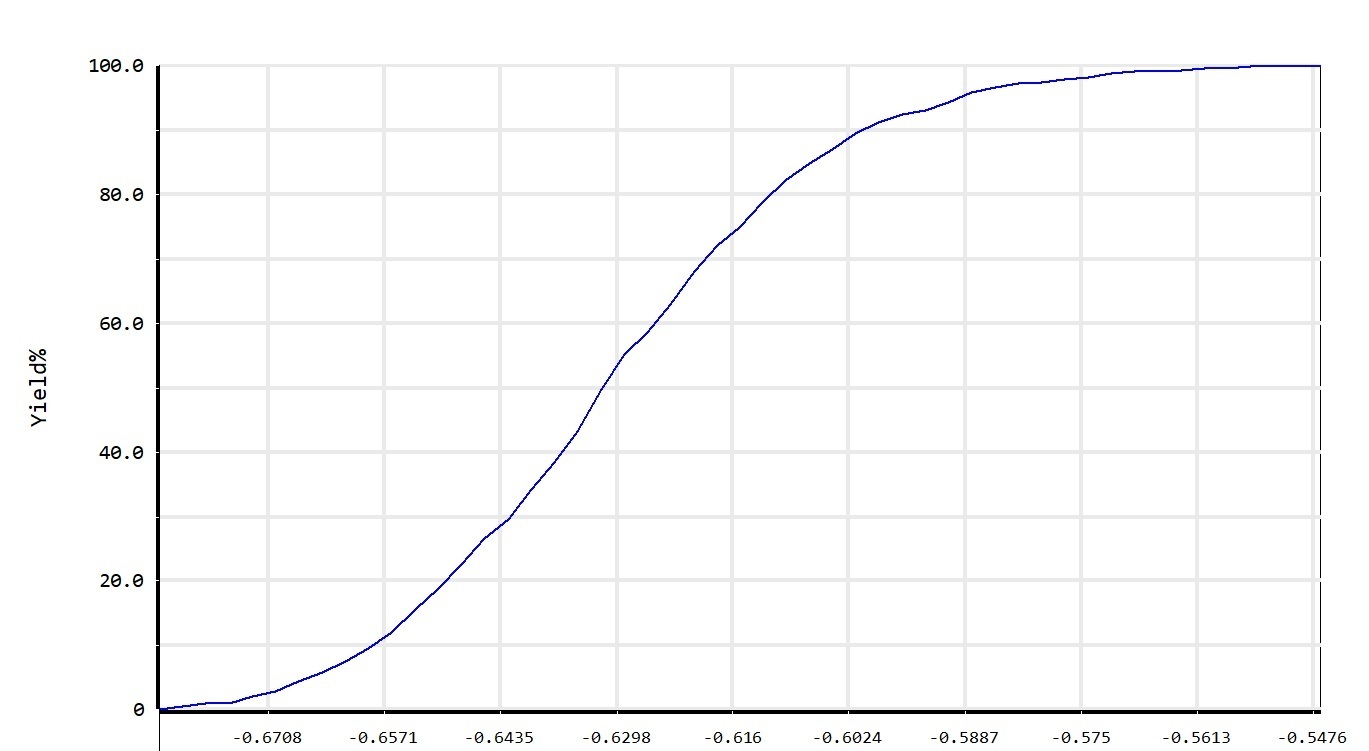
Tolerance Yield analysis
Best answer by Sandrine Auriol
Hi Ilia
You can’t really change that from my understanding because the Yield is a plot of your data.
I suppose it is more the definition of the criterion that has to be changed.
That being said, you could export the data for now on Excel for example and plot it there. But OpticStudio will plot the merit function or any reported values.


Reply
Enter your E-mail address. We'll send you an e-mail with instructions to reset your password.
Need more help?
To Chinese users:
Do not provide any information or data that is restricted by applicable law, including by the People’s Republic of China’s Cybersecurity and Data Security Laws ( e.g., Important Data, National Core Data, etc.).
不要提供任何受适用法律,包括中华人民共和国的网络安全和数据安全法限制的信息或数据(如重要数据、国家核心数据等)。