Question

Tangential and sagittal RMS spot size vs. spectrometer resolution

  • 6 April 2021
  • 4 replies
  • 734 views

  • Anonymous
  • 0 replies

Good morning,


I am designing a broadband spectrometer (currently in sequential mode). I think someone may answer the following questions way faster than I can.


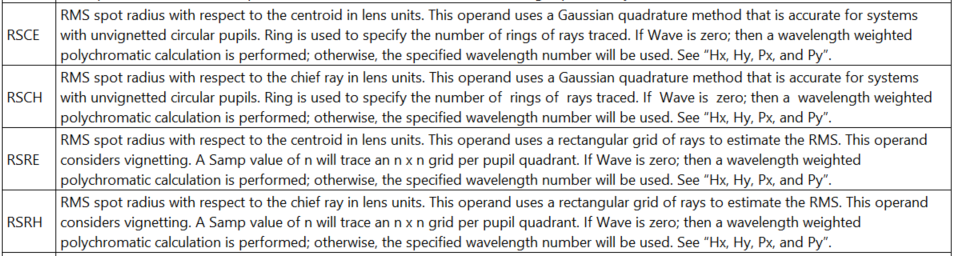
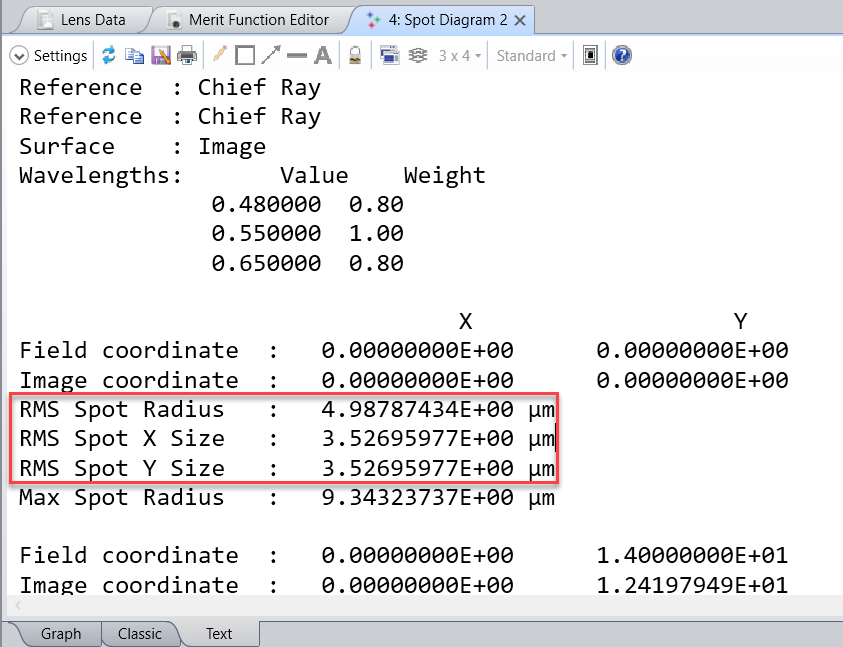
I am interested in measuring the spot size in the dispersion direction (therefore not as a general RMS parameter, as it is usually given). Is there a way in Zemax to automatically measure it through the merit function?


I know that the optimization wizard allows to choose a X Weight and an Y Weight. Is there any reference I can read of the topic?


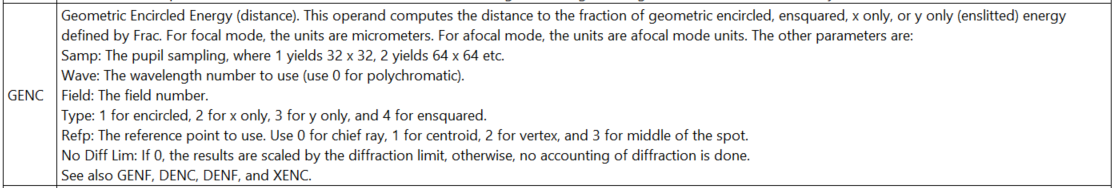
Can you advice any specific reference on how to relate the calculated RMS spot size in Zemax to the spectrometer resolution?


Thank you very much,


Cinzia


4 replies

Userlevel 5
Badge +2

Hi Cinzia, 


Thanks for your question here on the forums!


Unfortunately, currently there isn’t an operand that can directly return the RMS spot X and Y size in the Merit Function Editor. The only way to have the RMS spot size separated in X and Y and access them in the Merit function editor is what you described, by using the default merit function wizard with criterion set to “Spot” and assign zero weight to either X or Y.  You may find more info about this in the Help system at: The Optimize Tab (sequential ui mode) > Automatic Optimization Group > Optimization Wizard > Optimization Function Criteria


The RSRE and RSCE operands can only return the overall RMS spot radius:


210406-161041-image.png


There might be two workarounds for this problem:


  1.  
  2. Use ZPLM to access the Text tab of the Spot Diagram and return the values to the Merit function editor. Spot Diagram Text tab reports the separated RMS Spot X and Y size.

    210406-161254-image.png

    In the macro you can use GETT Numeric Function to pull these values and then use ZPLM operand to write them back to the Merit function editor.

    210406-161559-image.png
  3. Use the GENC operand which can report the geometric enclosed energy along the X and Y directions separately. If you enter an energy fraction of 100%, this will be the Geometric X and Y spot size. You won’t get the exact RMS, but you will be able to estimate the X and Y spot size based on the radius along X and Y for a certain enclosed energy fraction.

    210406-161744-image.png


The first approach may not allow you to optimize, which makes it less useful. If your goal is to optimize, you could use the second approach or simply add the RMS spot X and Y size using the default merit function with TRCX and TRCY.


You may read more about the optimization operands in the Help at:The Optimize Tab (sequential ui mode) > Automatic Optimization Group > Merit Function Editor (automatic optimization group) > Optimization Operands (Alphabetically)


Regarding the spectrometer resolution, I would suggest to check out our articles about spectrometer design, it discusses resolution in detail: 

How to build a spectrometer - theory

How to build a spectrometer - implementation


I hope this helps, but if you have any further questions, please let us know and we will be happy to help!


Best,

Csilla


Dear Csilla,


thank you for your reply.


Is there a way to get the RMS Spot X and Y size from the Full Field Spot Diagram? I am modeling the slit as the object and I would like to check the influence on the resolution. I only get, again, the global RMS radius, but is is very different in X and Y directions. It is important for the resolution evaluation in the spectrometer design. I attach an image an example. I inserted a total of 7 field points to model the slit.


Bests,


Cinzia

Userlevel 5
Badge +2

Hi Cinzia,


Thanks for your follow-up question here!


Unfortunately, the separate RMS Spot X and Y sizes are not available in the Full Field Spot Diagram currently.


Thank you for bringing this to our attention. I have gone ahead and submitted this internally as a feature request on your behalf.


Please keep in mind that feature requests are weighed based on impact, difficulty to implement, and the number of users who request it. A request is not a guarantee that the feature will be added to a future release. These feature requests are very important to us and shape the future of OpticStudio, so we appreciate your input regarding desired functionality.


In the meantime, please check out these knowledgbase articles about how to address spectrometer resolution:

How to build a spectrometer - theory

How to build a spectrometer - implementation


Best,

Csilla


Userlevel 6
Badge +2

Hi Cinzia,


You could measure the centroid positions of the image of each field. That would be the operands CENX/CENY. The centroids + RMS would give you an idea of the size of the image of the slit.


Another possibility can be to use the Image Simulation / Geometric Image Analysis. There was a similar post recently here: XY scan


Also this example shows a different way to set-up the slit: '\Zemax\Samples\Sequential\Diffractive components\Sample Spectrometer.ZMX'


Let us know if that helps and do not hesitate if you have any further questions.


Sandrine


Reply