We recently implemented the Geometric Image Analysis in ZOSPy 1.30. While doing so, we noticed that the setting PlotScale seems not to exposed in the ZOS-API for this analysis. Is that correct?

Solved
PlotScale missing in ZOS-API for Geometric Image Analysis
Best answer by MichaelH
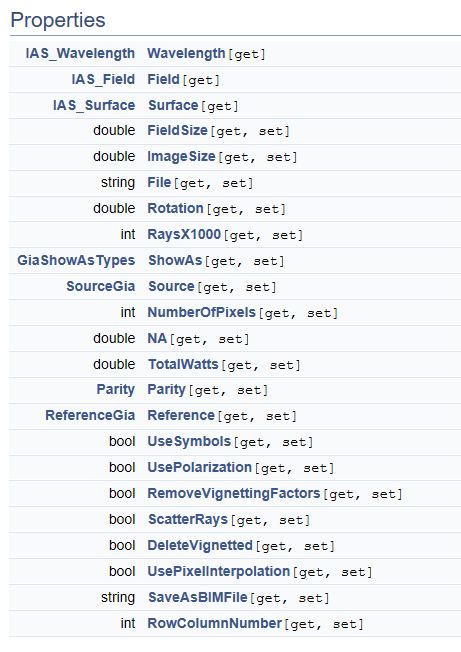
The PlotScale field doesn’t actually change the calculation (if you look at the Text Tab, the raw values are still the same). The PlotScale only changes the displayed image on the Graph Tab. Therefore, the PlotScale will only help with the Interactive Extension since this is only changes the display. There are other aspects of the display (like cutting panes, zoom, and panning for a 3D Layout).
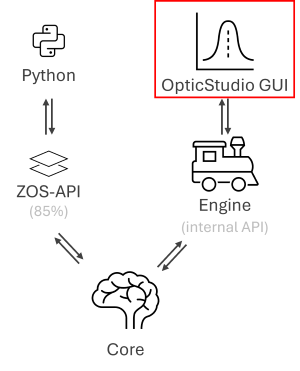
You can think of OpticStudio as having 3 layers: the Core, the Engine, and the GUI. The Engine is the internal API that acts like the glue/communication layer between the Core and the GUI. The ZOS-API is an external facing API and has somewhere around 85% code coverage (give or take). Since the ZOS-API never talks to the GUI, anything that is implemented only in the GUI (red box below) is unlikely to show up in the ZOS-API.
As for the Interactive Extension, this was originally a debugging tool for the developers when creating the ZOS-API to make sure everything was working correctly. The engineering staff quickly realized the power of this and renamed the tool to Interactive Extension. Although the development team might be able to hook up the PlotScale, since the ZOS-API doesn’t have complete code coverage yet, I think the development team will work on connecting the ZOS-API to the Core before adding visualization effects.

Enter your E-mail address. We'll send you an e-mail with instructions to reset your password.
Need more help?
To Chinese users:
Do not provide any information or data that is restricted by applicable law, including by the People’s Republic of China’s Cybersecurity and Data Security Laws ( e.g., Important Data, National Core Data, etc.).
不要提供任何受适用法律,包括中华人民共和国的网络安全和数据安全法限制的信息或数据(如重要数据、国家核心数据等)。