How can I extract detector data using the API? And how can I be sure I'm using the correct settings?

Solved
Methods for extracting detector data through the API
 +2
+2Best answer by Allie
There are a few methods for extracting the detector data through an API script – most of which are exemplified in samples #8 and #24 within the {Zemax}\ZOS-API Sample Code folder. Based on those samples, we see there are two general interfaces we can use, which I will outline below.
ZOSAPI.Analysis.I_Analyses Interface
The I_Analyses interface allows us to call a Detector Viewer object in the same way we would open one within the GUI. This method has the advantage of having a very explicit set of controls for choosing the type of data you want.
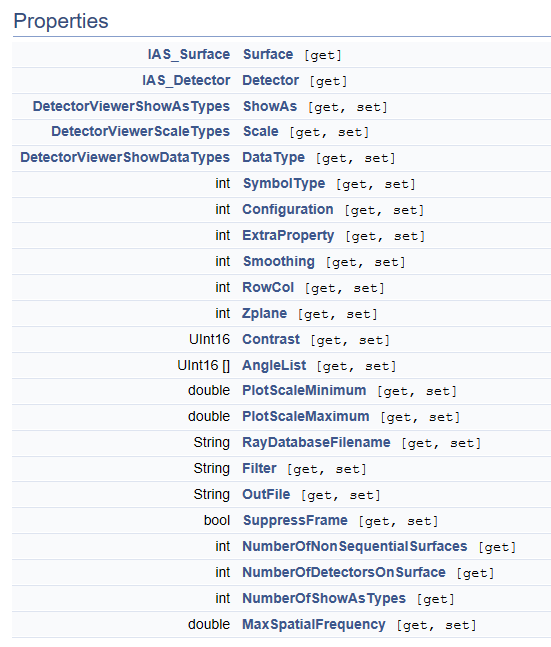
When you open a detector, you can update the view and the type of data that’s pulled in. If you don’t update the settings, then the detector opens with the last-saved settings. Using the API, you can choose which detector to look at, what type of data you would like to look at, and more – all provided within the Syntax Guide’s page on “ZOSAPI.Analysis.Settings.RayTracing.IAS_DetectorViwere Interface Reference”.
Once you’ve updated the settings, you can apply them and pull the results. If you are using a full color plot, the results will be given as a Data Grid. If you’re using a cross section view, the results will be given as a Data Series. If you’re using a Detector Color, then the results will be given as a Data Grid or Data Series RGB. I have discussed how to extract results in this forum post.
The disadvantage to this method is that opening the Detector Viewer may take extra time for a detector with a large amount of pixels. Additionally, you should be sure to close the window after you extract the data or else you will have many windows open that will slow down computation time.
Below is an example of how many of the settings can be updated in the MATLAB API to update the Detector Viewer results. The variable type required for each setting is given in the IAS_DetectorViewer help page (shown above).
TheSystem = TheApplication.PrimarySystem;
% Open the Detector Viewer
detector = TheSystem.Analyses.New_Analysis(ZOSAPI.Analysis.AnalysisIDM.DetectorViewer);
% Open the settings of the Detector Viewer
detSettings = detector.GetSettings();
% Select which detector we care about
detSettings.Detector.SetDetectorNumber(7);
% Select data to Show As type (enumerated variable)
detSettings.ShowAs = ZOSAPI.Analysis.DetectorViewerShowAsTypes.FalseColor;
% Select the Data Type we want (enumerated variable)
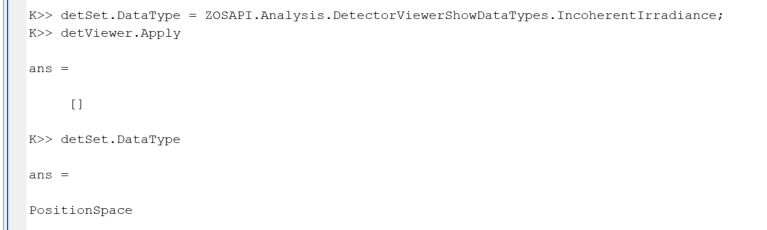
detSettings.DataType = ZOSAPI.Analysis.DetectorViewerShowDataTypes.CoherentIrradiance;
% Select the scale (enumberated variable)
detSettings.Scale = ZOSAPI.Analysis.Settings.DetectorViewerScaleTypes.Linear;
% Set the Smoothing (integer value)
detSettings.Smoothing = 2;
% Select the Maximum Plot Scale (double value)
detSettings.PlotScaleMaximum = 20.0;
% Save to an output file (string value)
detSettings.OutFile = 'Detector_7_Image.JPG';
% Apply the settings
detector.ApplyAndWaitForCompletion();
ZOSAPI.Editors.NCE.INonSeqEditor
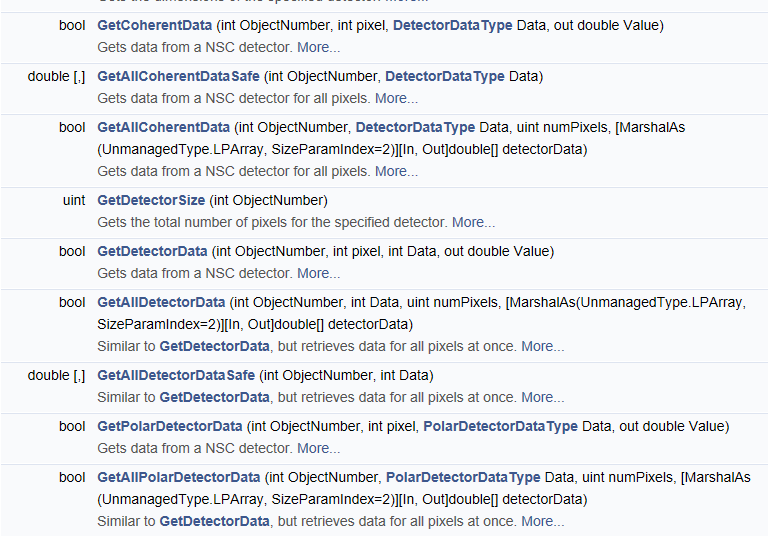
The INonSeqEditor interface provides us with several properties that allow us to immediately extract detector data without needing to open a Detector Viewer. This is similar in functionality to the NSDD optimization operand except here, the data will be pulled as a full matrix of information, instead of as a single value.
For a Detector Rectangle, one of the properties we can use is GetAllDetectorDataSafe. This property requires us to declare an array to store the data, and asks us to provide two inputs: detector number and data type. The detector number corresponds to the object number in the NSCE, and the data type refers to flux, flux/area, or flux/solid angle. The type of data you pull (Incoherent vs Coherent) will be given by the property you choose. GetAllDetectorDataSafe will deliver incoherent. For coherent data, use GetAllCoherentDataSafe.
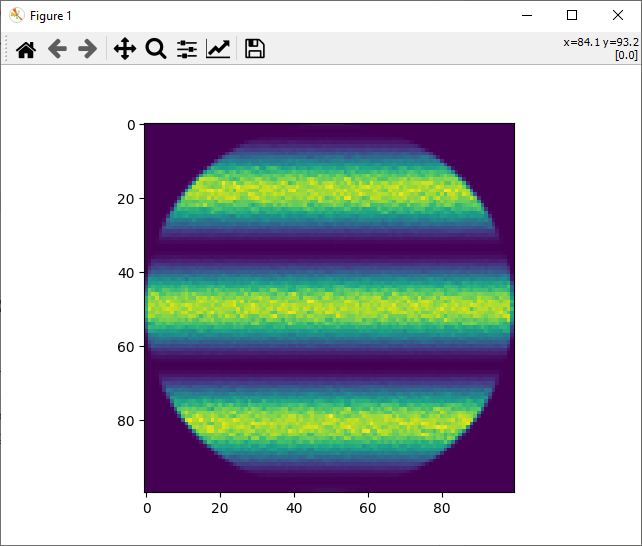
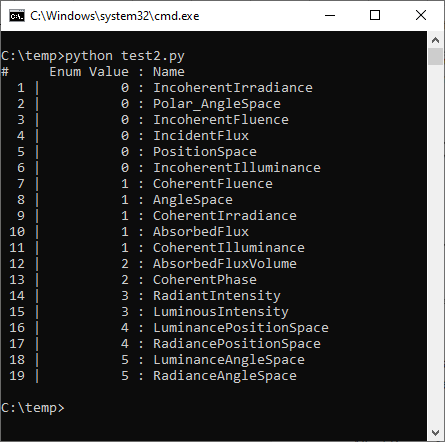
Here is an example in Python of how this property can be utilized. This will pull flux/area data for detector 7. Detector 7 has the parameter Data Type set to '0', so I will get a matrix of Incoherent Irradiance data.
TheNCE = TheSystem.NCE

detector7 = TheNCE.GetAllDetectorDataSafe(7,1)

data7 = np.flipud(detector7)

plt.imshow(data7)
There are several other properties for this type of data extraction, and they are all in the INonSeqEditor Interface:


Enter your E-mail address. We'll send you an e-mail with instructions to reset your password.
Need more help?
To Chinese users:
Do not provide any information or data that is restricted by applicable law, including by the People’s Republic of China’s Cybersecurity and Data Security Laws ( e.g., Important Data, National Core Data, etc.).
不要提供任何受适用法律,包括中华人民共和国的网络安全和数据安全法限制的信息或数据(如重要数据、国家核心数据等)。