Solved

How to save detector viewer graphical plot into image file by ZOS-API ?

  • 29 August 2021
  • 7 replies
  • 922 views

Hello,


I would like to save graphical plot in detector viewer into a picture file by ZOS-API.

I looked at some similar questions in community but most of those tell that “get numerical data and draw a plot using the numerical data” or “that feature is in request” 1 year go.

So, I am wondering if that feature is implemented already or not.

To me, GUI already has that feature and hence it seems that if there is a function in ZOS-API  to call that feature in GUI, it gets the job done. 


Does anybody know that?


Regards

Kazu


icon

Best answer by Csilla Timar-Fulep 31 August 2021, 18:19

View original

7 replies

Userlevel 5
Badge +2

Hi Kazu,

Thank you for your question here on the forums!

You may easily save the graphical results of the Detector Viewer in the GUI by using the Output Image File option as below:

The corresponding property in ZOS-API is the OutFile property of the Detector Viewer. You may find more details about it in the ZOS-API Syntax Help at the ZOSAPI.Analysis.Settings.RayTracing.IAS_DetectorViewer Interface Reference:

To use this function, I modified the sample code for Example 10 - NSC ZRD Filter String, the MATLAB code would look like the following:

% Open Detector Viewer, view previously saved .zrd file
DetectorView = TheSystem.Analyses.New_DetectorViewer();
DetectorView_Settings = DetectorView.GetSettings();
DetectorView_Settings.RayDatabaseFilename = 'e10_API_Raytrace.ZRD';
DetectorView_Settings.ShowAs = ZOSAPI.Analysis.DetectorViewerShowAsTypes.FalseColor;
DetectorView_Settings.Filter = 'X_HIT(2, 4)'; % Detector will only display rays which hit object 2 exactly 4 times
DetectorView_Settings.OutFile = 'myPic.jpg';
DetectorView.ApplyAndWaitForCompletion(); % Apply Settings to Detector Viewer
%! [e10s03_m]

For more details about how to save images with the output file option, please check out the Help system at:
The Analyze Tab (non-sequential ui mode) > Detectors Group > Detector Viewer


As for the option of pulling the raw data and then making a plot inside the ZOS-API, please see these forum threads:

Methods for extracting detector data through the API | Zemax Community 

How do I output the image of an analysis in ZOS-API? | Zemax Community

I hope this helps, but if you have any further questions, please do not hesitate to ask!

Best,
Csilla

Hello Csilla-san


Thank you very much for your help on this.

I tried that option but it gave me only the plot part and it does not include scales and legend as shown below.


If I save from Detector Viewer window, it gives the following.


Can’t I generate this whole picture from ZOS-API?


Regards

Kazu


Userlevel 5
Badge +2

Hi Kazu,

Thanks for your follow-up here!

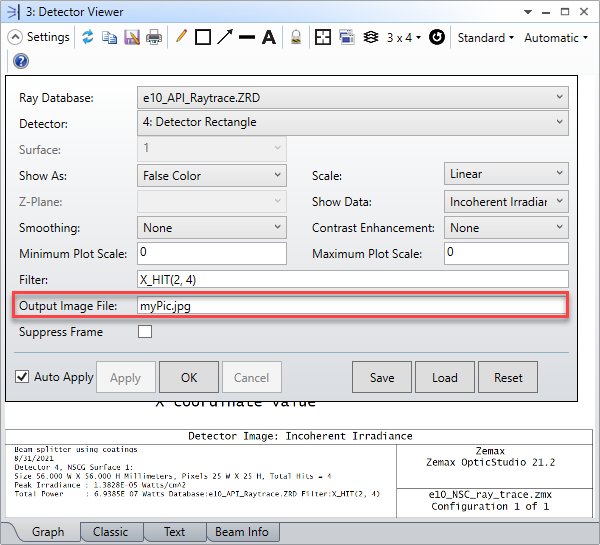
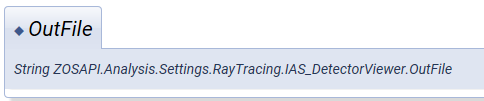
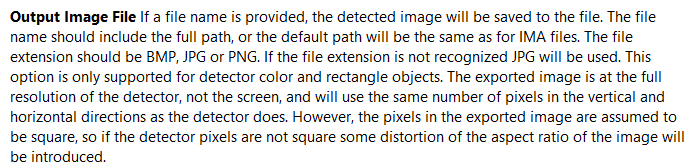
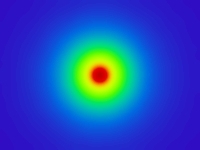
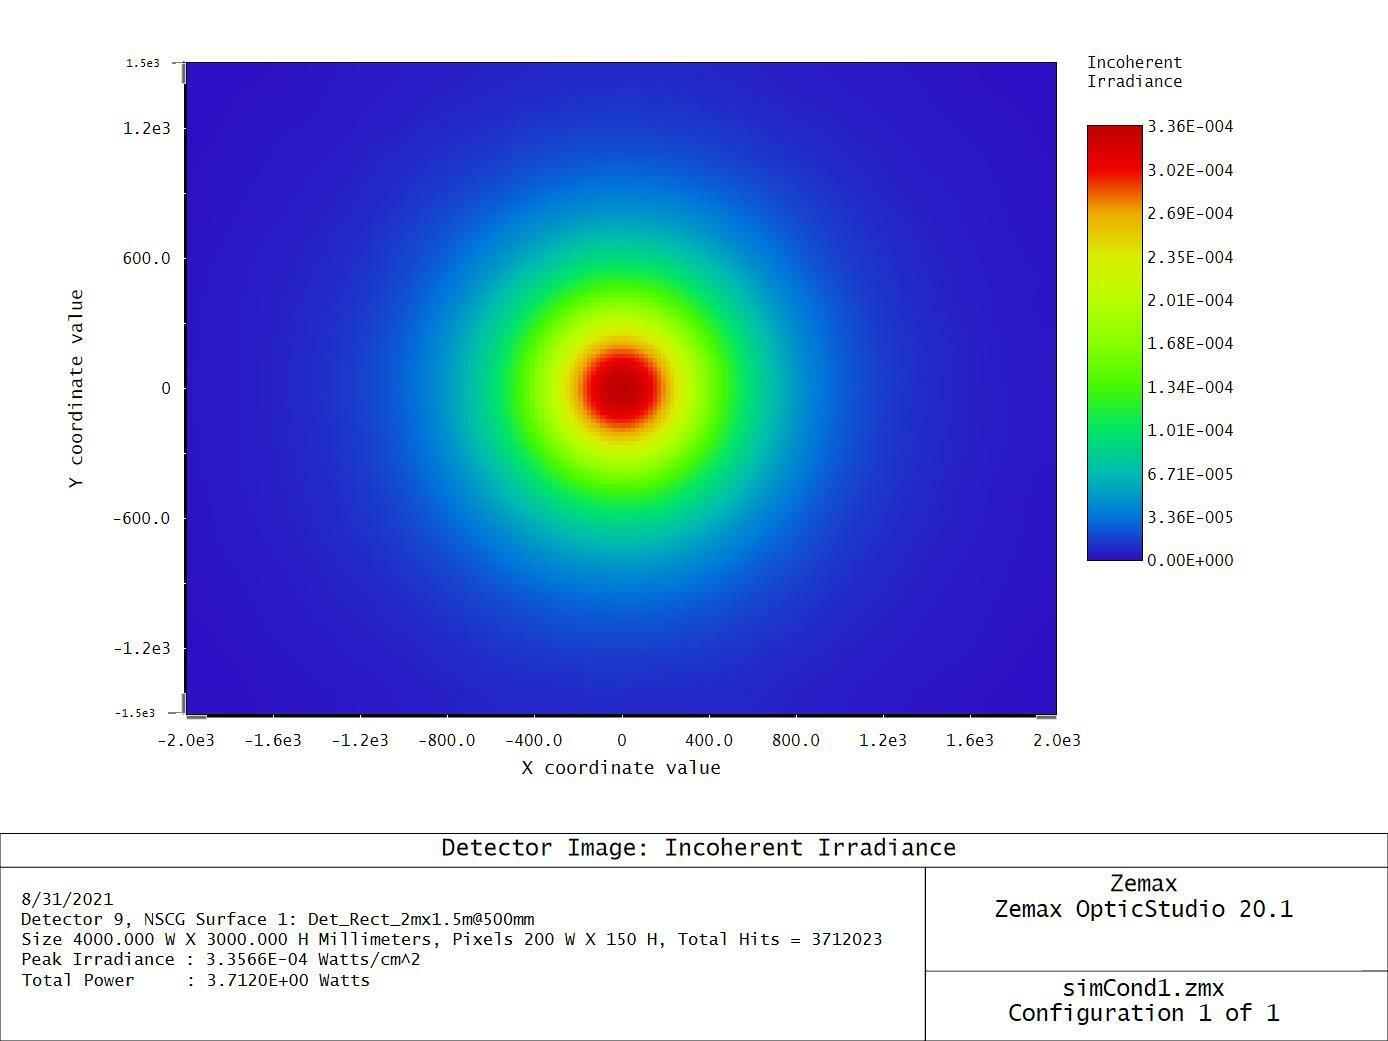
Yes, you are correct, the Output Image File (or OutFile as from the API) option only saves the plot itself, without any scales, footnotes, or headers. 

If you would like to use the extra info stored in the header/footnote as shown in the GUI, then you will need to pull that data from the API as discussed in this forum thread below:
How can I pull Peak Irradiance or Total Hits from the Detector Viewer analysis in the API? | Zemax Community

Then you will need to make your own plot in the API with the labels added separately.

Unfortunately, currently we do not directly support saving images from the API. The analogue to this function in the user interface (clicking the "Save" button in the GUI windows) isn't hooked up to the API. However, there is an existing feature request for this capability in our internal system. I have gone ahead and voted for this request on your behalf. Thank you for bringing this to our attention again.

Please keep in mind, that feature requests are weighed based on impact, difficulty to implement, and the number of users who request it. A request is not a guarantee that the feature will be added to a future release. However, these feature requests are very important to us and shape the future of OpticStudio, so we appreciate your input regarding desired functionality.

At this time, there is one possible workaround to this problem, but it will only work in the Interactive Extension. It will not work in a Standalone Application. The workaround involves a ZPL macro using keywords OPENANALYSISWINDOW and EXPORTJPG/EXPORTBMP. You will need to write a ZPLM operand which calls the ZPL macro using those keywords. Then add the ZPLM operand to your Merit Function, and update the Merit Function Editor. In this way, every time when the Merit Function is updated, the ZPL macro will run and an image will be saved. The drawback here is that the Merit Function is updated multiple times when an optimization is running. You will need to be careful about when you include the ZPLM operand and make sure to remove it before optimizing.

For further references please see these forum threads:
Automatically saving analysis windows with ZOS-API | Zemax Community
How to run macro via ZOSAPI | Zemax Community

Best regards,
Csilla

Hello Csilla-san


Thank you very much for your answer and your making the request for implementation.

I understood it depends on its priority.

Meantime, I will follow your suggestion to implement it by myself.


Regards

Kazu


Another vote by me!

Thank you

IGM

Userlevel 6
Badge +4

Please add my vote as well. I would like to be able to save any of the graphics windows, including layouts, to a png or jpg. It would enable us to export the image and then import it to an interactive Python or Mathematica window. This would allow us to confirm the actions and to produce good documentation easily.

Please add my vote too.

In my case I want to save shaded mode, and there is no “output image file” in the GUI.

analysis.ToFil() returns empty image !


I totally agree with David !

Reply