

In Non-sequential mode, there is no feature to make the detector result iso-line.
Therefore, if ZOS-API functions such as Python or Matlab are used, iso-line mapping is possible using detector data.
This is where the first community post about iso-line comes from Displaying IsoLux Lines | Zemax Community
#Define detector object number
detnum=3

# get number of pixels in X, Y
dims_bool_return, X_detectorDims, Y_detectorDims = TheNCE.GetDetectorDimensions(detnum, 0, 0)

# Create array to store flux data for each pixel
pix = []
length = pix.__len__()
while pix.__len__() < X_detectorDims * Y_detectorDims:  # loop through pixels, store value in pix
    length += 1
    pix_bool, value = TheNCE.GetDetectorData(detnum, length, 1, 0)
    pix.append(value)

# get size of the detector
Xlength = TheNCE.GetObjectAt(detnum).GetObjectCell(ZOSAPI.Editors.NCE.ObjectColumn.Par1).DoubleValue
Ylength = TheNCE.GetObjectAt(detnum).GetObjectCell(ZOSAPI.Editors.NCE.ObjectColumn.Par2).DoubleValue


# make a pixel array to 2D dimension
def convert_1d_to_2d(pix, X_detectorDims):
    return [pix[i:i + X_detectorDims] for i in range(0, len(pix), X_detectorDims)]
For Iso-line code, there are many codes in open-source. So, you can refer the information that you want to use.
Density and Contour Plots | Python Data Science Handbook (jakevdp.github.io)
python - Adding extra contour lines using matplotlib 2D contour plotting - Stack Overflow
# Iso-line code
x = np.linspace(-Xlength, Xlength, X_detectorDims) #X axis
y = np.linspace(-Ylength, Ylength, Y_detectorDims) #Y axis
X, Y = np.meshgrid(x, y)
Z = convert_1d_to_2d(pix, X_detectorDims)
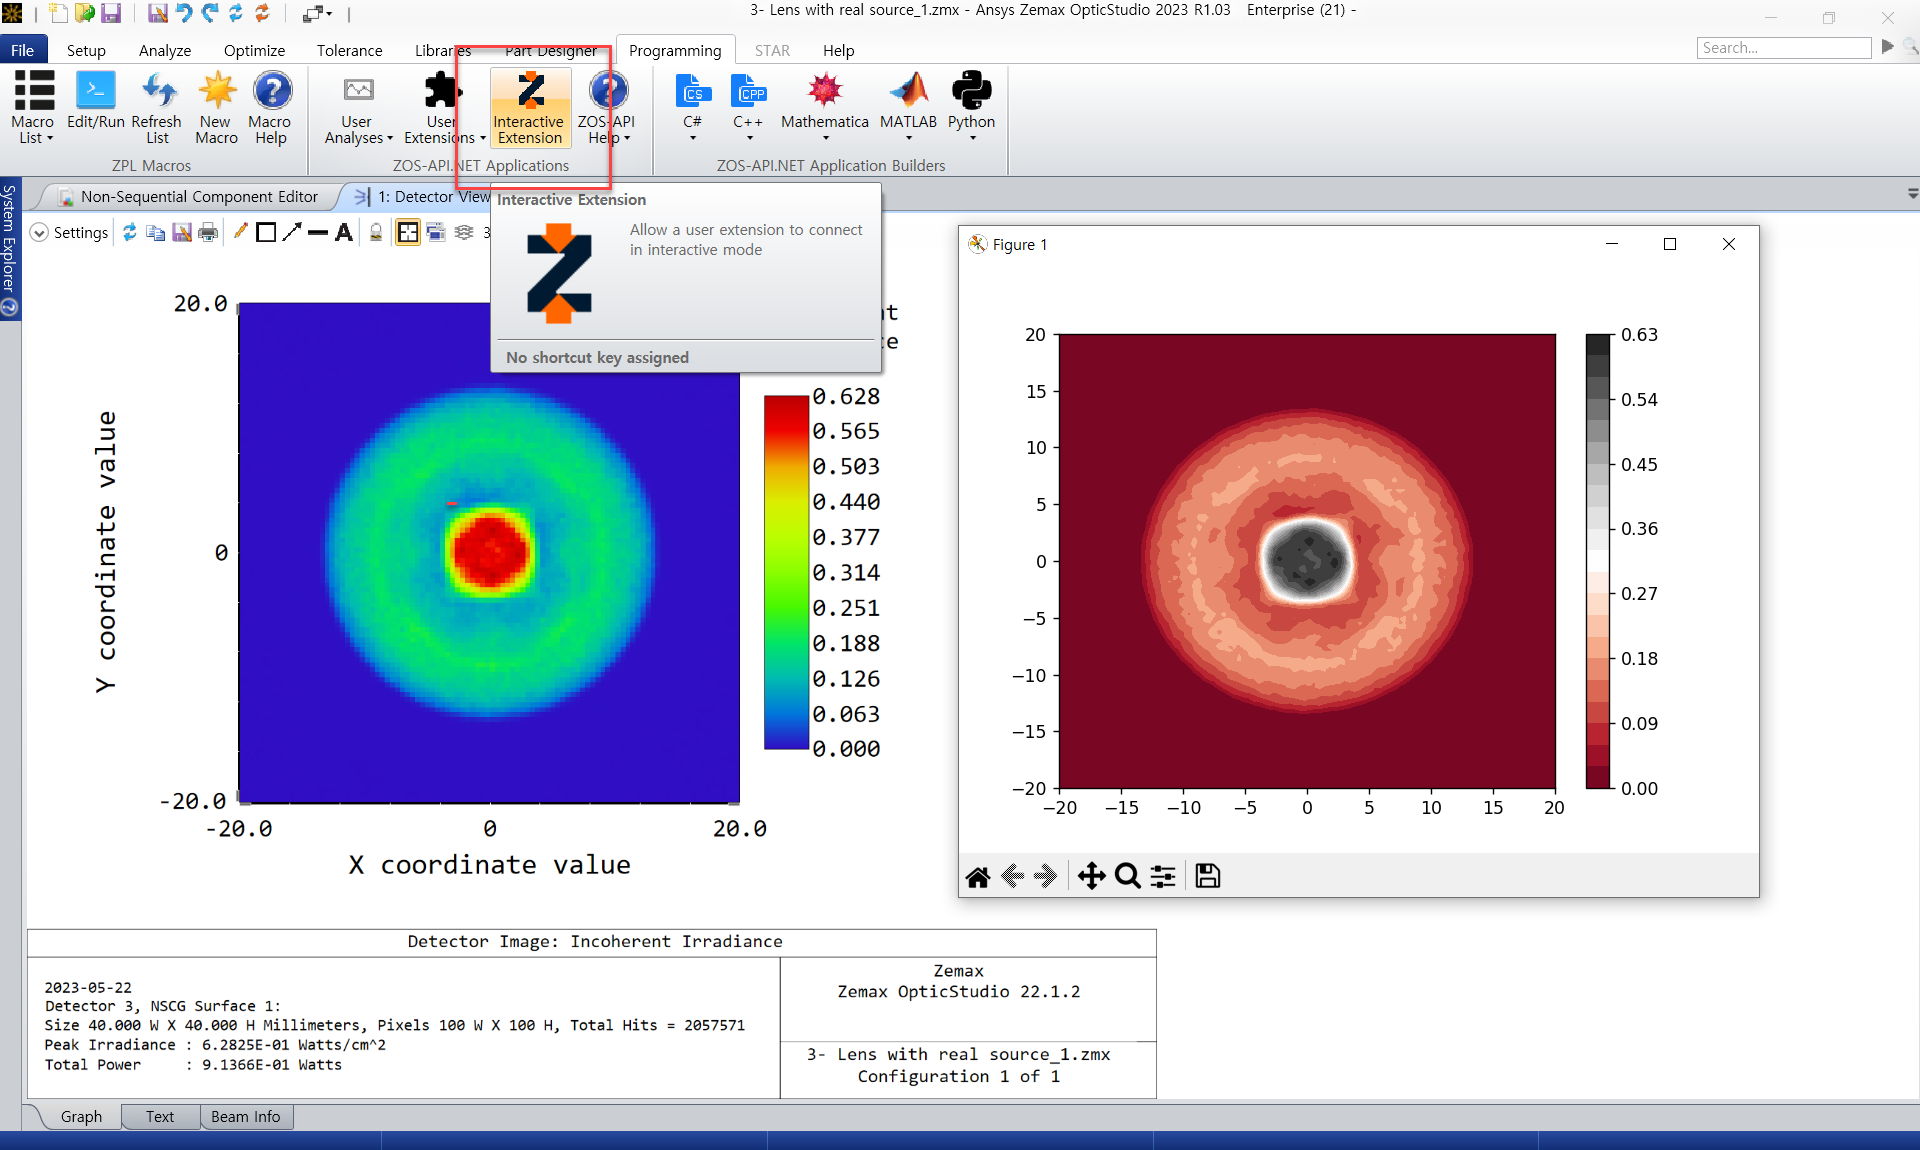
plt.contourf(X, Y, Z, 20, cmap='RdGy')
plt.colorbar();
plt.show()