Solved

Zernike standard phase. Coefficients 7 and 8 issue.

  • September 20, 2024
  • 1 reply
  • 138 views

mpreciado

Hi,


I have been tring to reproduce the phase produce by the Zernike standard phase, and I believe there is an issue with the terms 7 and 8, corresponding with vertical and horizontal coma.


Theoretically they should be 

Z7=sqrt(8)*(3*ro.^3-2*ro).*sin(phi);

Z8=sqrt(8).*(3*(ro.^3)-2*ro).*cos(phi);


However, after a lot of headache I realized that they behave like:

Z7=sqrt(8)*(3*ro.^3).*sin(phi);

Z8=sqrt(8).*(3*(ro.^3)).*cos(phi);


Ithought maybe it a different stardard, but in the original paper referred


R. Noll, "Zernike polynomials and atmospheric turbulence", J. Opt. Soc. Am., Vol. 66, No. 3, p207 (1976)

The definition is sqrt(8)*(3*ro.^3-2*ro).*sin(phi).


It is pretty obvious noticing that radially is just a cubic term without the linear term when you represent the wavefront map. It does like the 7th (or 8th) order zernike represented in many places.


This is very surprising. Anybody else noticed this issue?

I am using Ansys Zemax OpticStudio 2023 R2.02.

Thanks,

Miguel


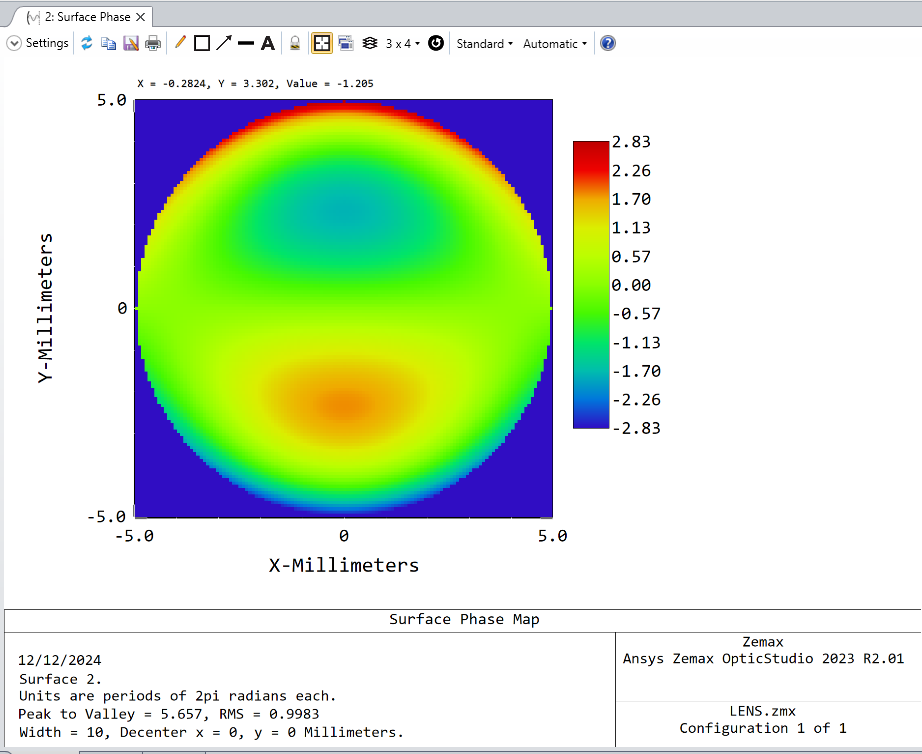
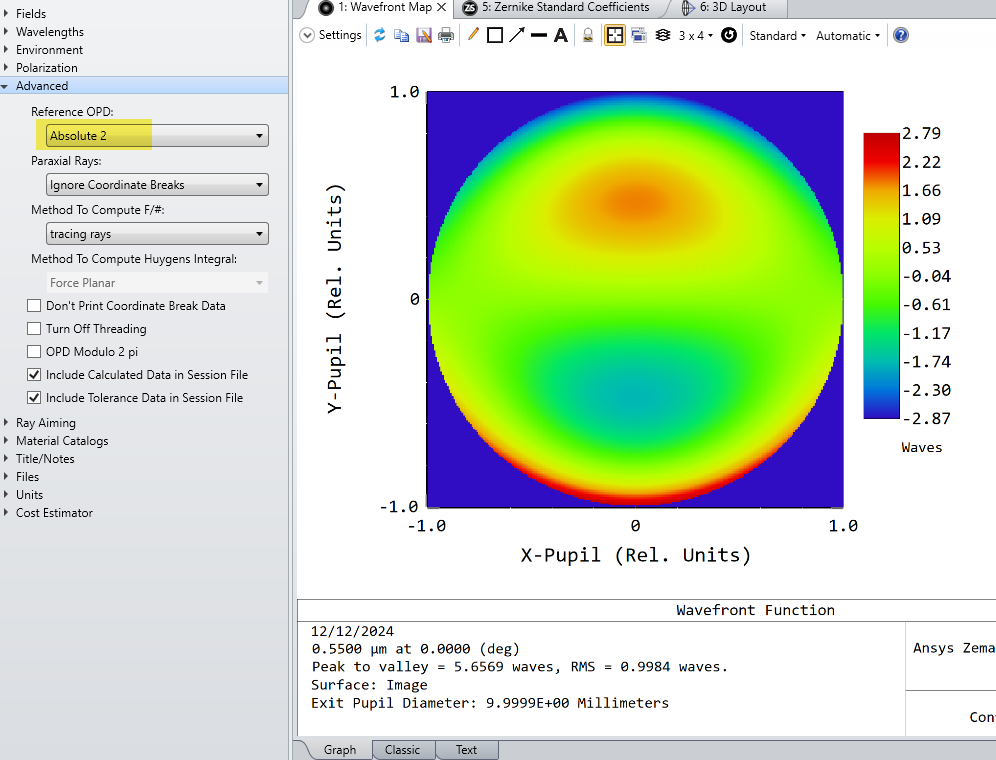
ZEMAX 7TH ORDER ZERNIKE


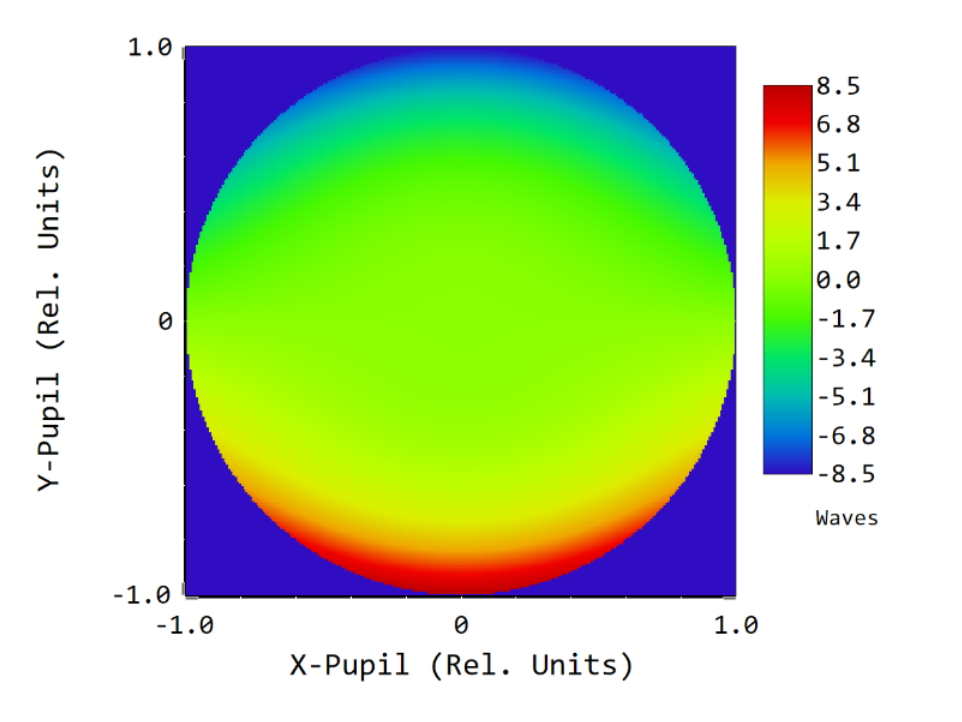
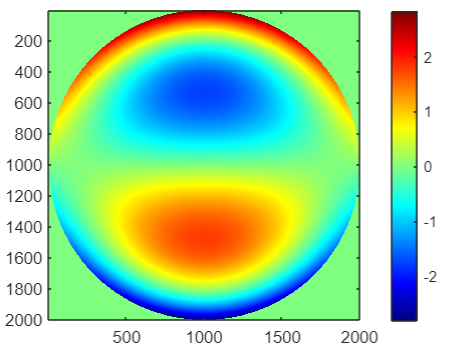
MATLAB USING THE STANDARD FORMULA:

sqrt(8)*(3*ro.^3-2*ro).*sin(phi).

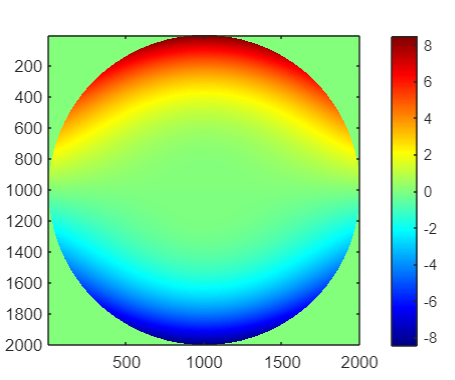
MATLAB USING THE “WRONG” FORMULA (Result simialr to zemax):

sqrt(8)*(3*ro.^3-).*sin(phi).


Representation of vertical coma in other sources (result similar to matlab with the standard formula):

http://optics.udjat.nl/monochromatic_eye_aberrations.htm


Best answer by Chris Normanshire

Hi Miguel,

Thanks for the question. I think the issue here is that you are comparing the surface phase computed by the formula to the wavefront map, which shows the OPD in the exit pupil referenced to the chief ray. If you instead use the Surface Phase plot then you can directly see the phase of the Zernike surface which matches expectations.

If you want to see a similar profile on the Wavefront Map then you can set System Explorer...Advanced...Reference OPD to ‘Absolute 2’. This removes the chief ray reference and computes the OPD directly at the image surface.

I hope this helps.

Chris

View original
Did this topic help you find an answer to your question?

1 reply

Chris Normanshire
Zemax Staff
Forum|alt.badge.img+2

Hi Miguel,

Thanks for the question. I think the issue here is that you are comparing the surface phase computed by the formula to the wavefront map, which shows the OPD in the exit pupil referenced to the chief ray. If you instead use the Surface Phase plot then you can directly see the phase of the Zernike surface which matches expectations.

If you want to see a similar profile on the Wavefront Map then you can set System Explorer...Advanced...Reference OPD to ‘Absolute 2’. This removes the chief ray reference and computes the OPD directly at the image surface.

I hope this helps.

Chris


Reply


Cookie policy

We use cookies to enhance and personalize your experience. If you accept you agree to our full cookie policy. Learn more about our cookies.

 
Cookie settings