Dear Seok,
I don’t think I can give you an answer, but here is one tip to increase your chances of getting a reply to your answer. Try to make it easy for everyone to reproduce your results. For example, give the Zernike coefficients in a format that can be copy/pasted into OpticStudio:
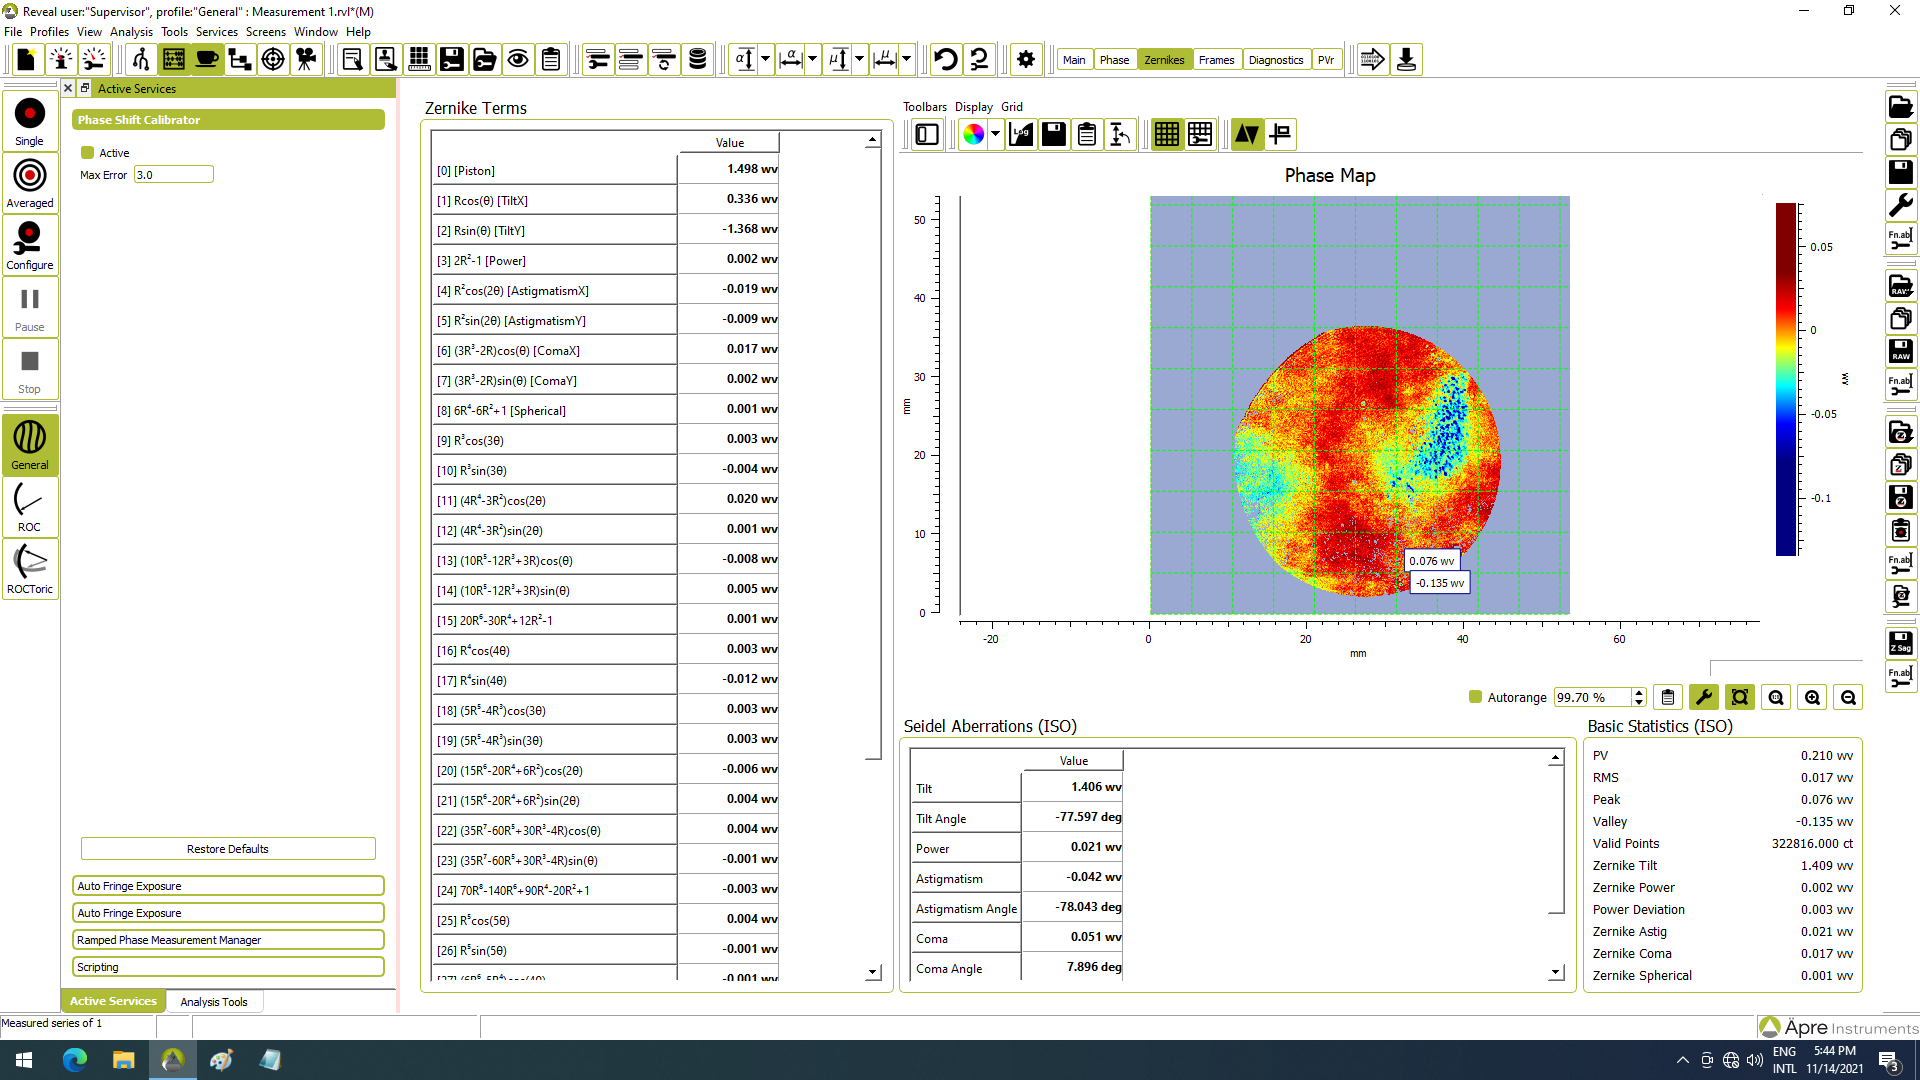
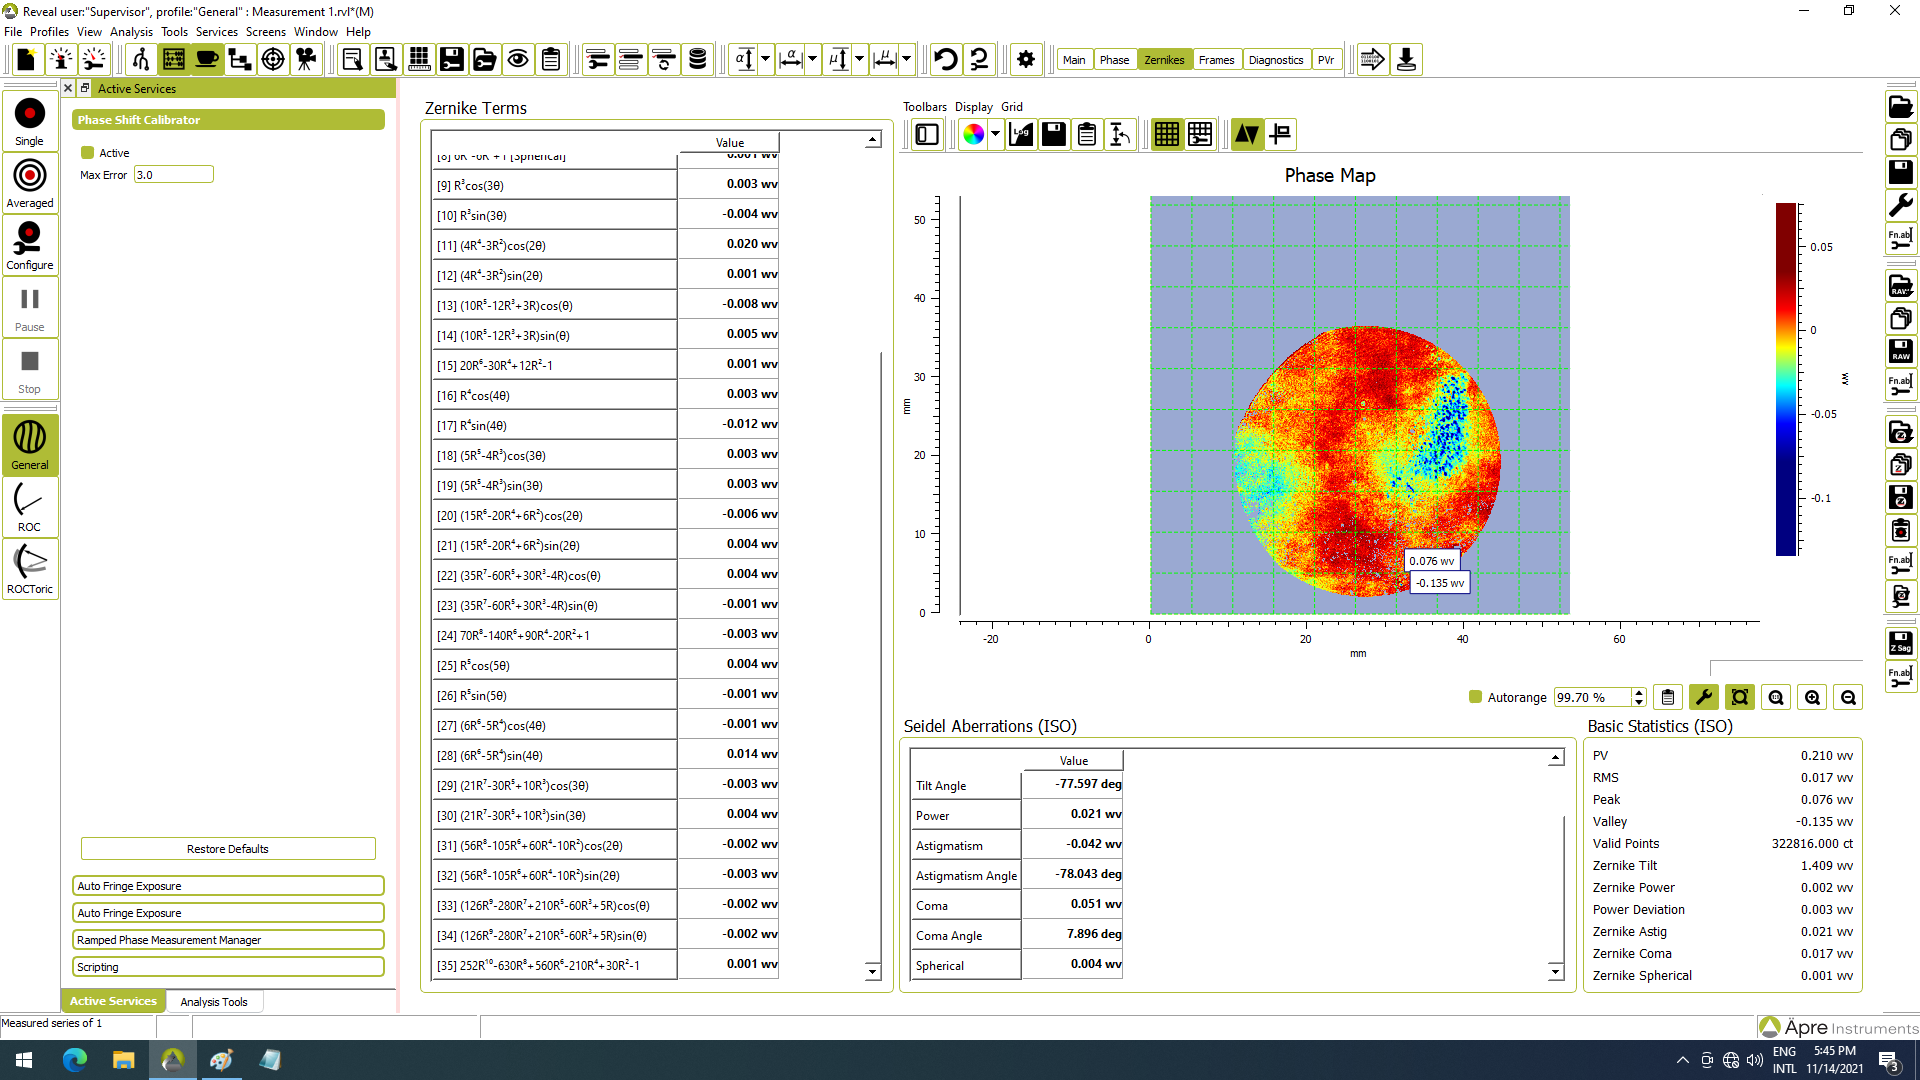
| Term | 0 | 1 | 2 | 3 | 4 | 5 | 6 | 7 | 8 | 9 | 10 | 11 | 12 | 13 | 14 | 15 | 16 | 17 | 18 | 19 | 20 | 21 | 22 | 23 | 24 | 25 | 26 | 27 | 28 | 29 | 30 | 31 | 32 | 33 | 34 | 35 |
| Value | 1.498 | 0.336 | -1.368 | 0.002 | -0.019 | -0.009 | 0.017 | 0.002 | 0.001 | 0.003 | -0.004 | 0.02 | 0.001 | -0.008 | 0.005 | 0.001 | 0.003 | -0.012 | 0.003 | 0.003 | -0.006 | 0.004 | 0.004 | -0.001 | -0.003 | 0.004 | -0.001 | -0.001 | 0.014 | -0.003 | 0.004 | -0.002 | -0.003 | -0.002 | -0.002 | 0.001 |
Or even better, upload a copy of your file.
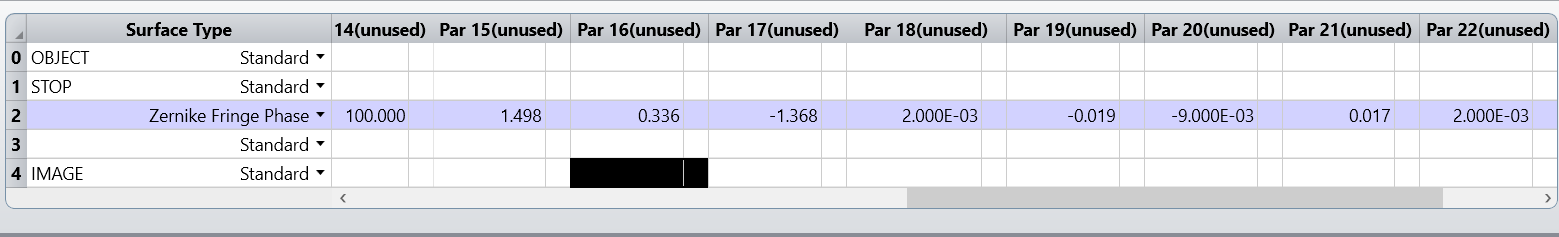
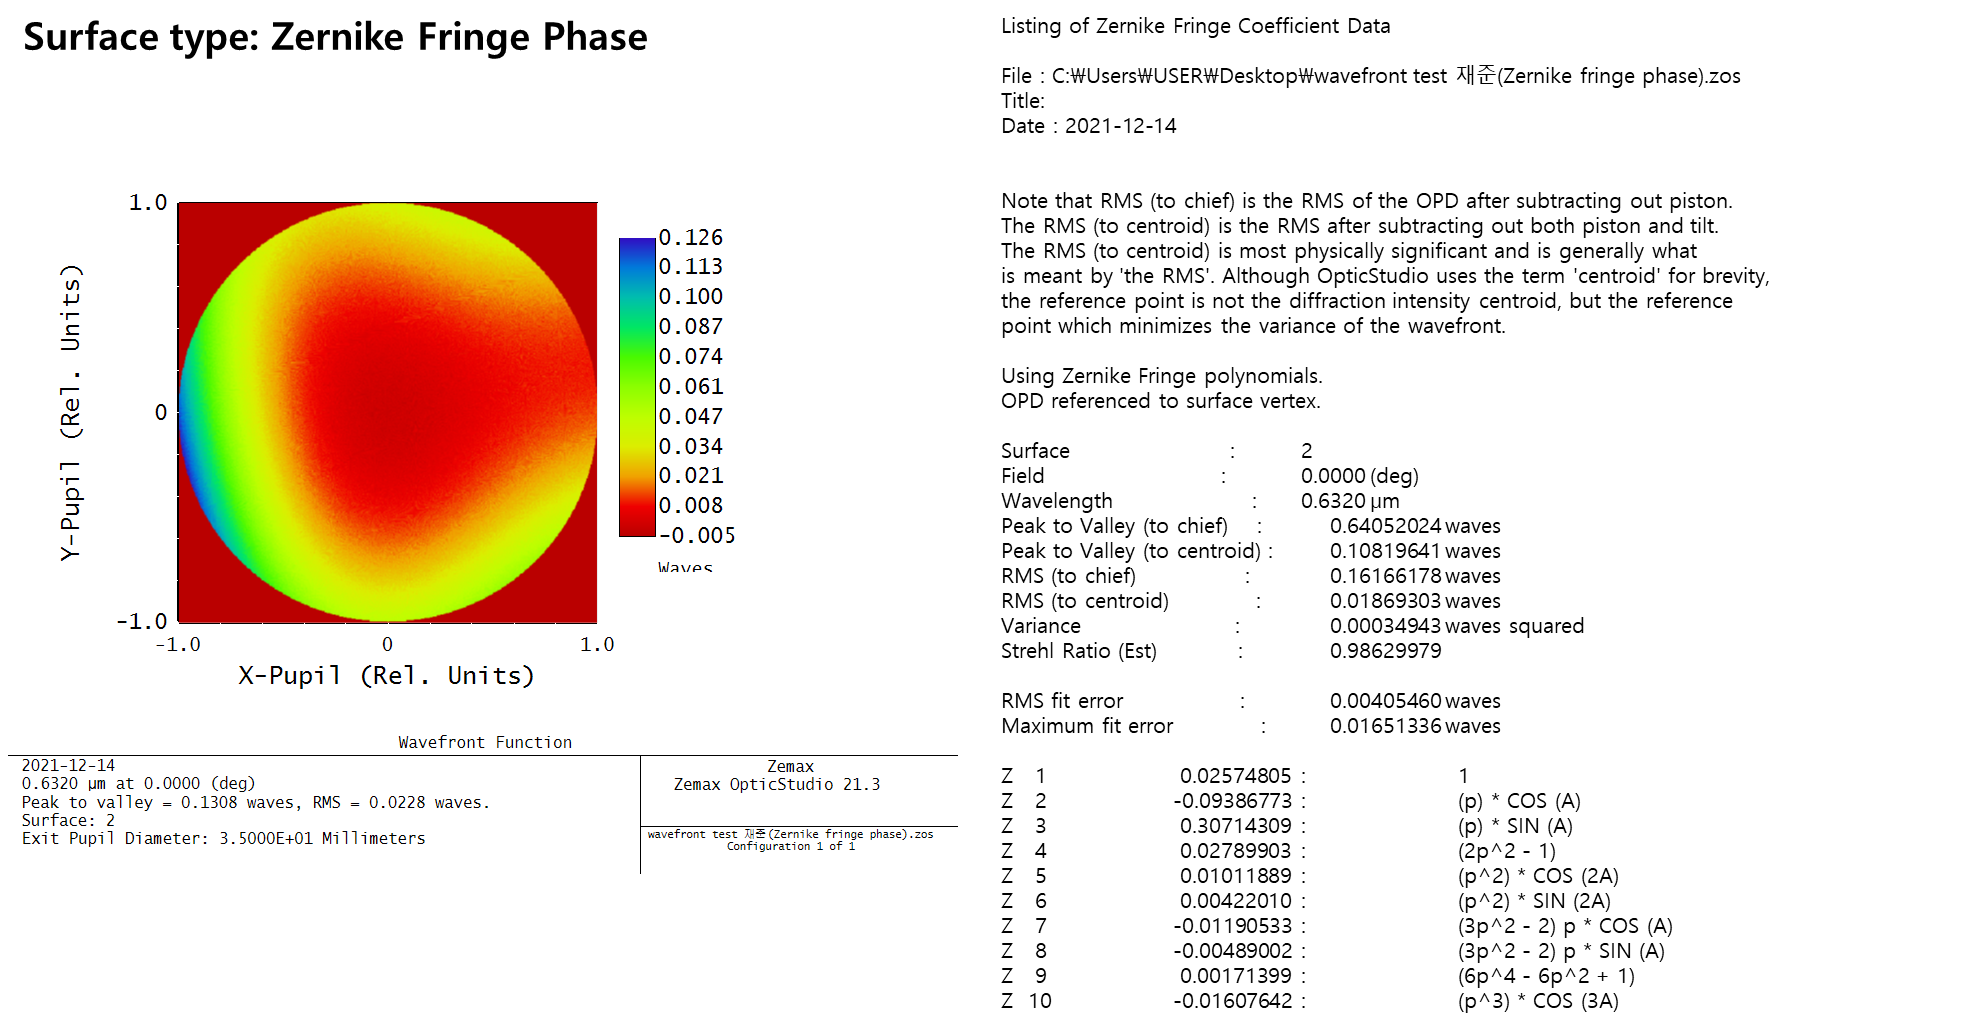
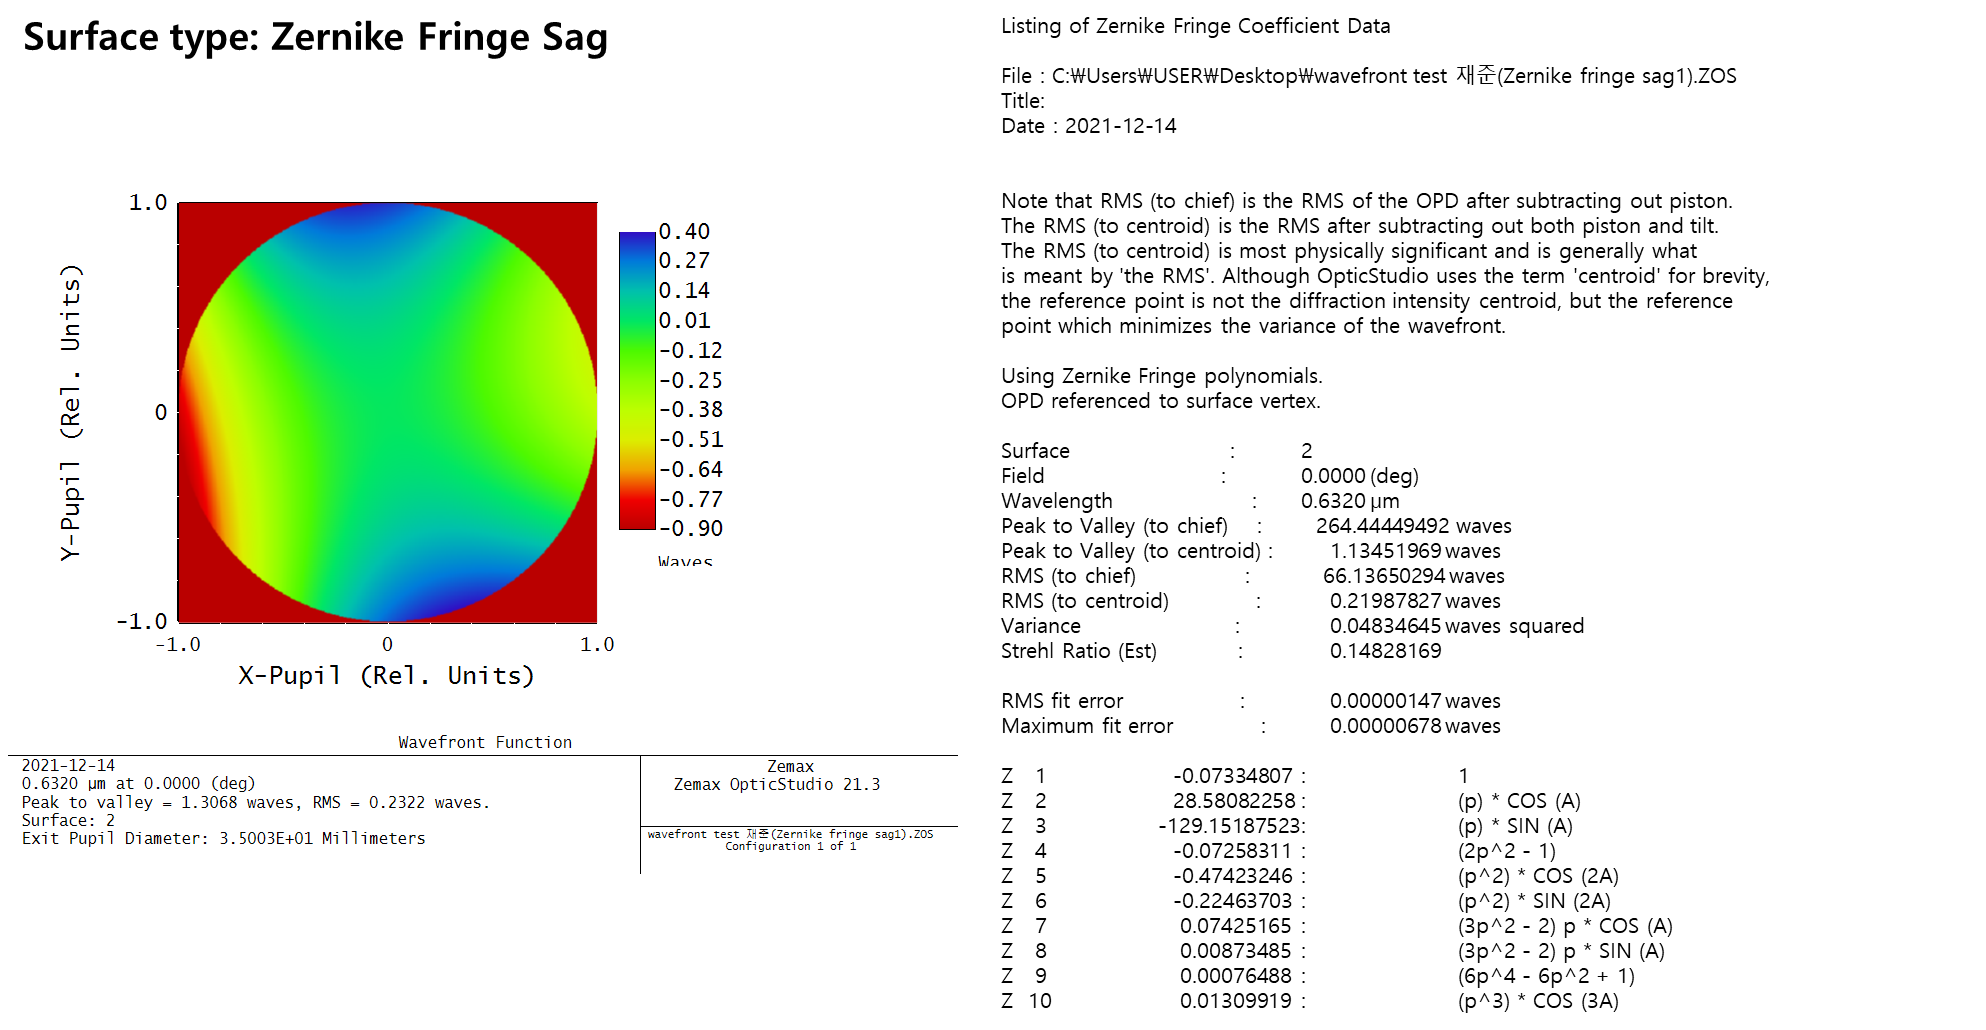
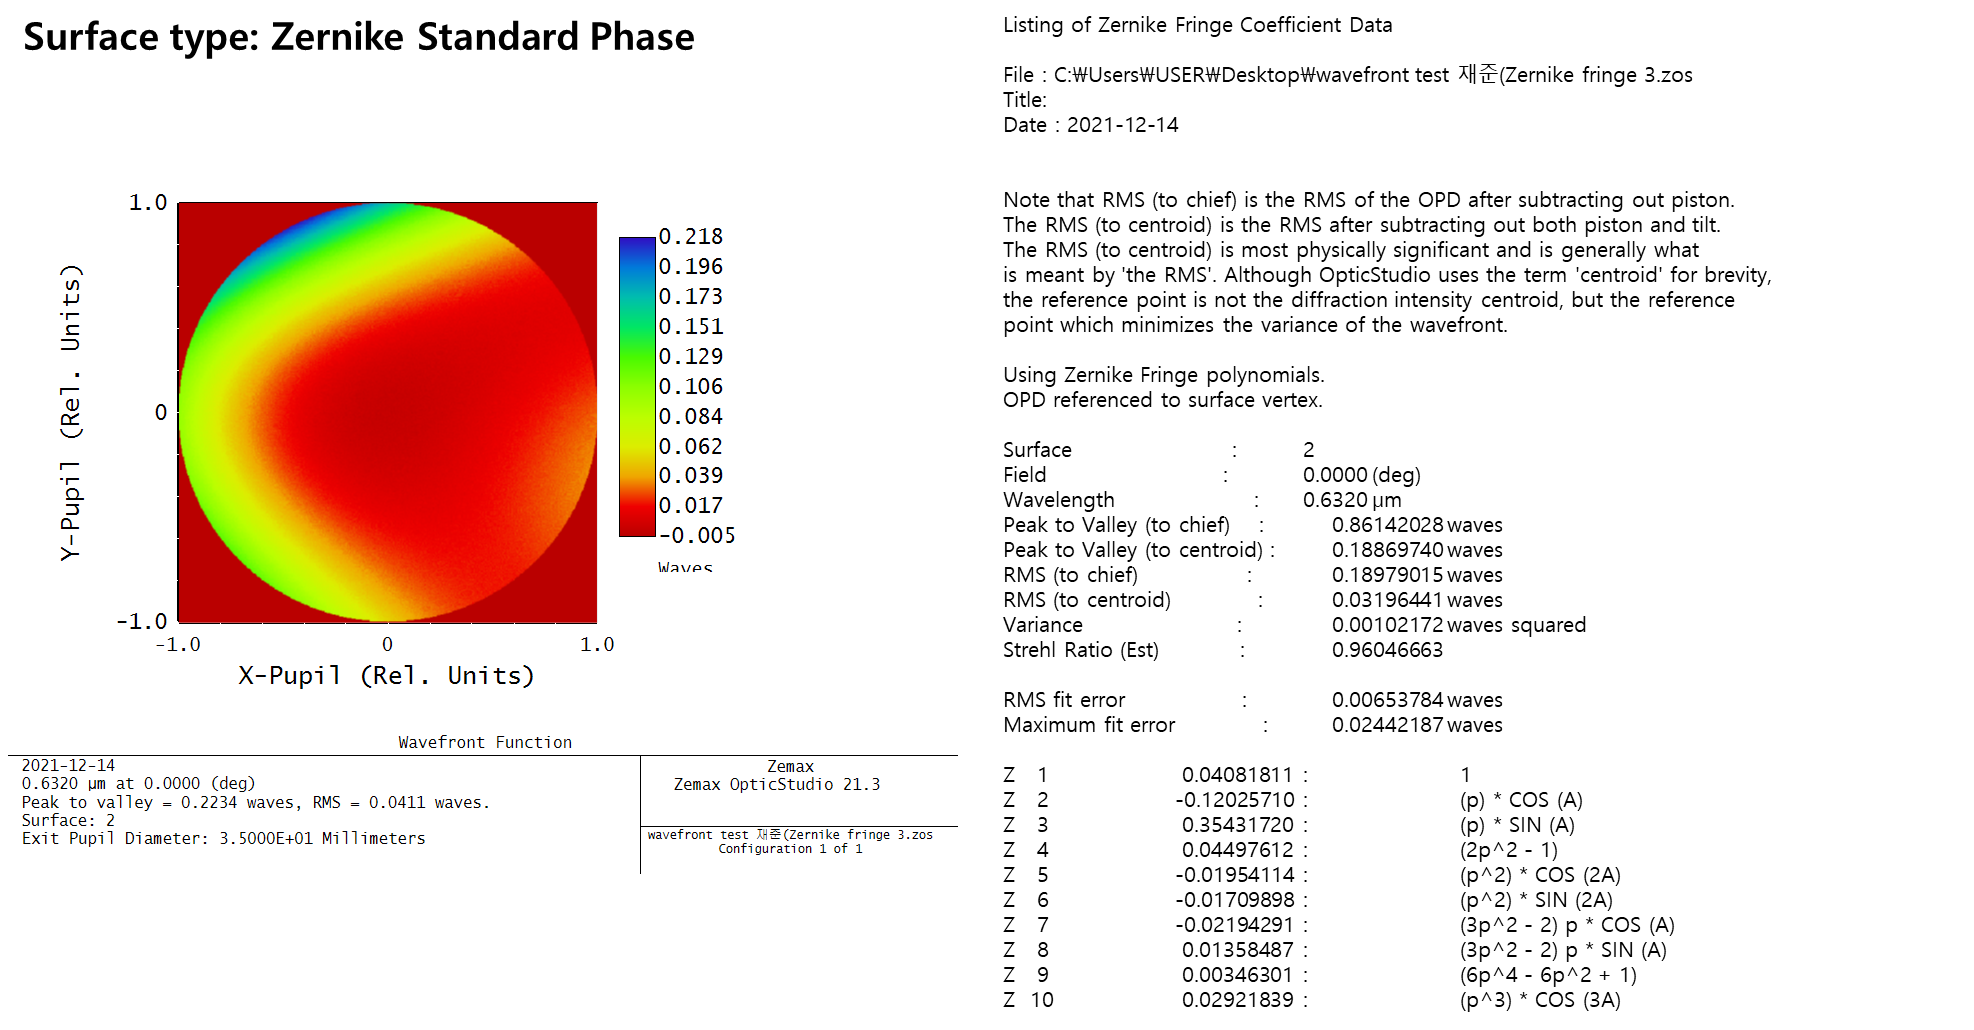
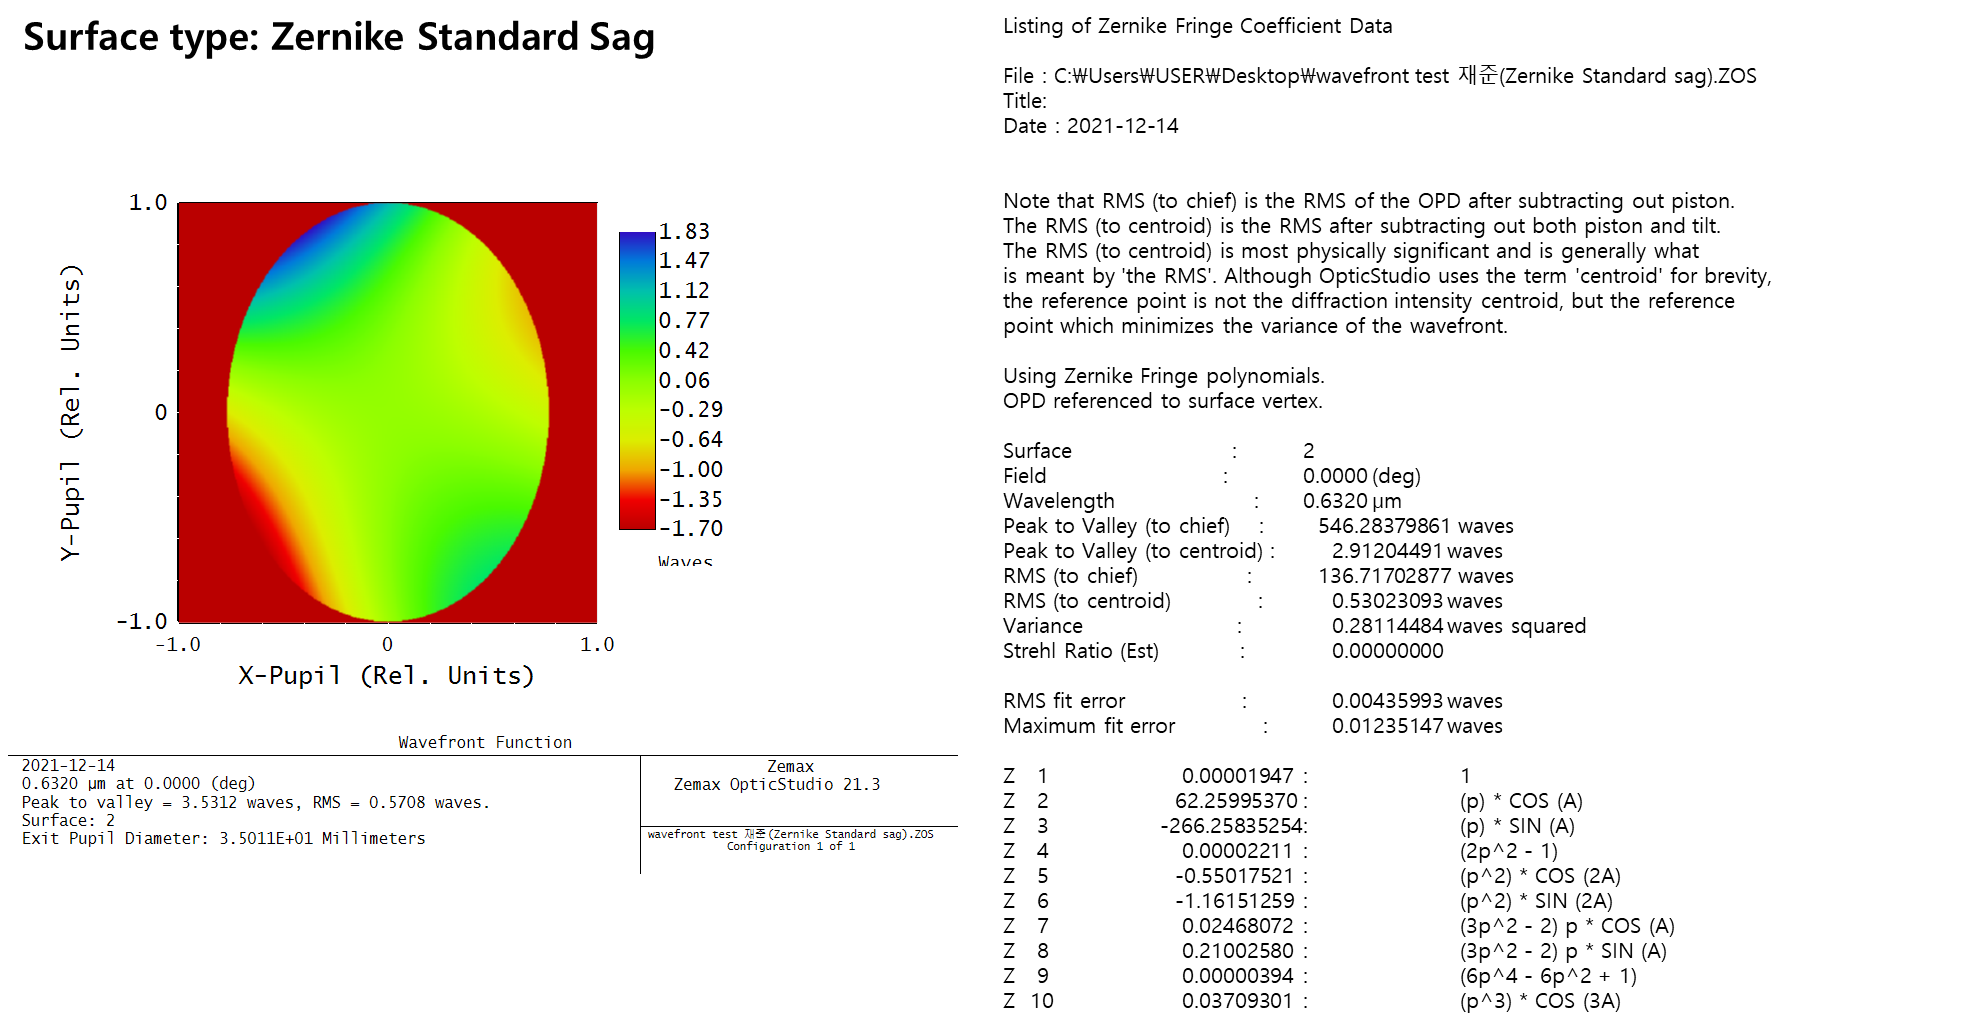
Also, can you tell us more about what software you used to record the coefficients, and perhaps how they define their Zernike coefficients? Based on what I see in the screenshot, it seems like you want to use the Zernike Fringe Phase surface (but not entirely sure). The numbers seem truncated, not sure this will have a significant effect.
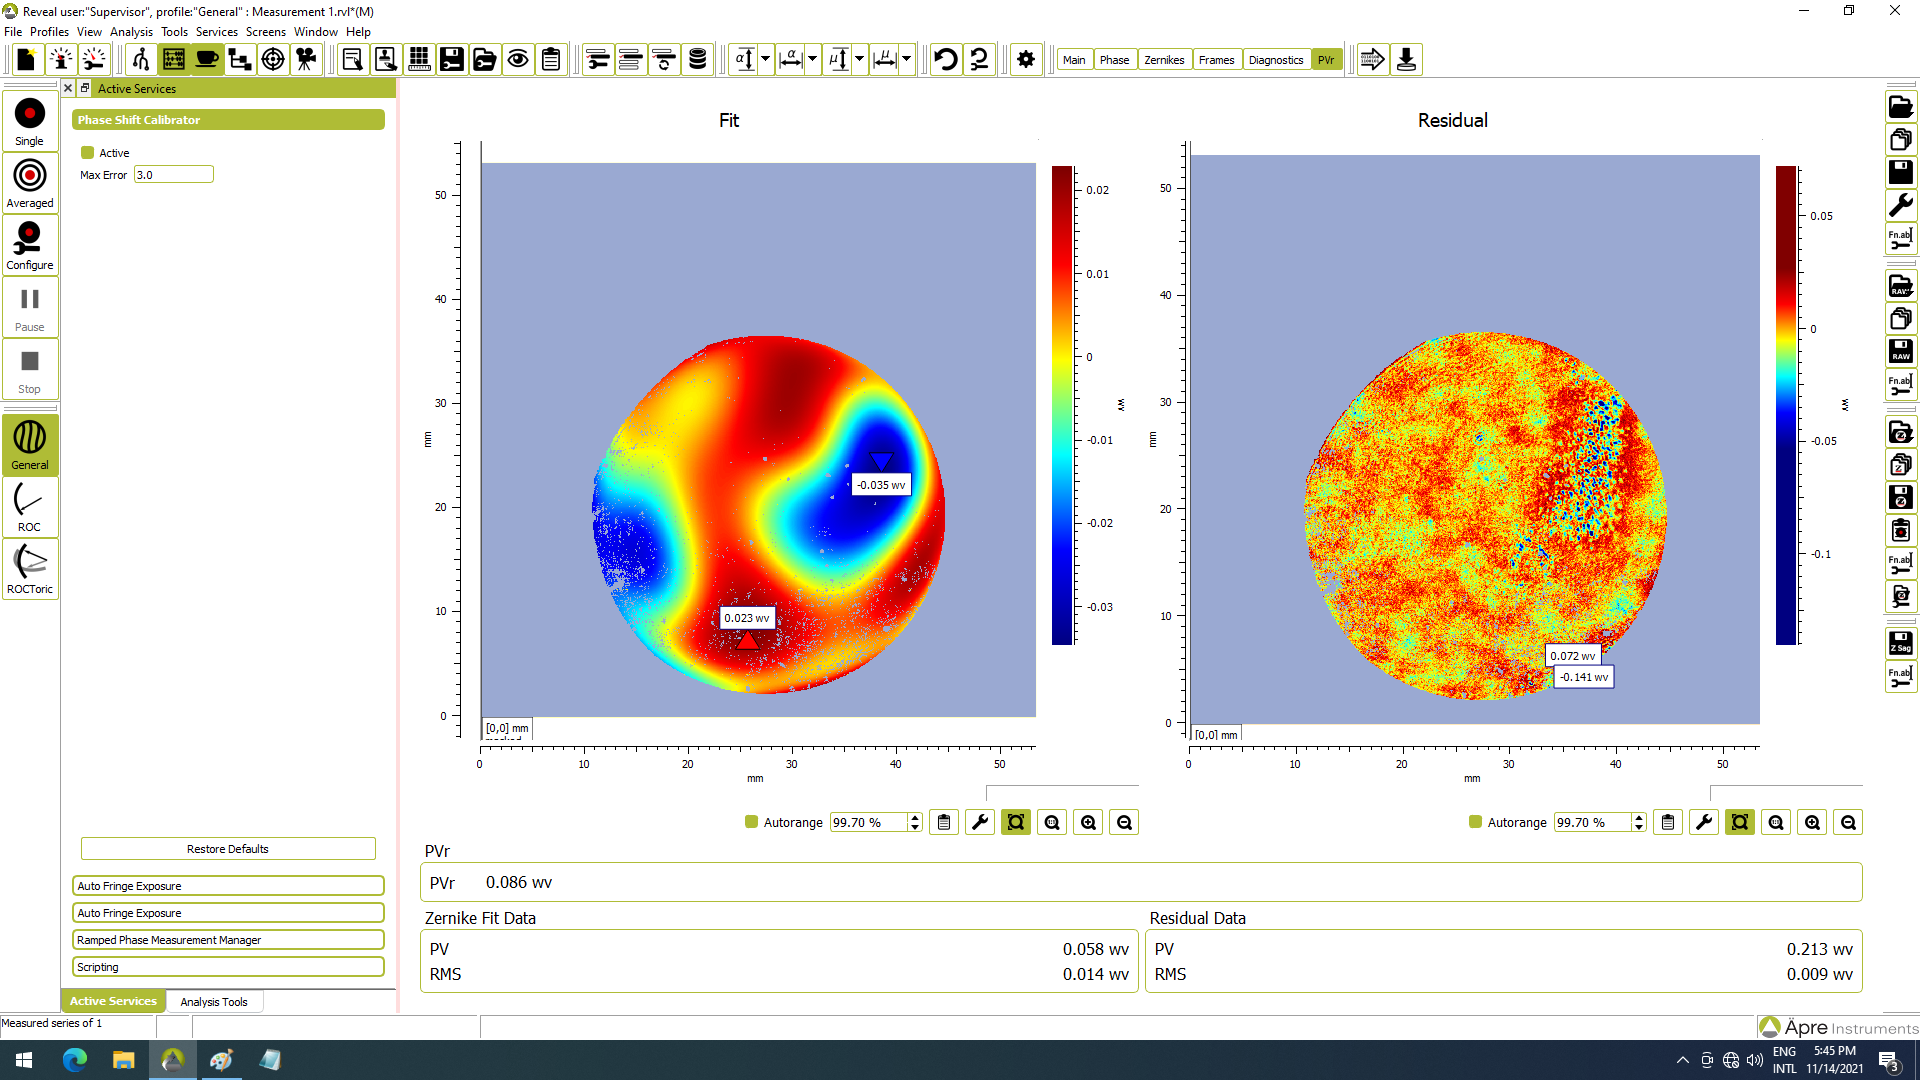
Finally, it seems you were using the default Norm Radius of 100 mm in your Zernike surface, but the exit pupil diameter is 35 mm, you may want to change your Norm Radius to correspond to the radius of your measured element, and you may need to Remove Tilt from the Wavefront Map to get the correct display, but then again, not completely sure without knowing what your software does.
I hope this will help you or someone else to give you an answer.
Take care,
David
@Seok Jae.Won did modifying the Norm Radius help address the issue?