This thread is dedicated to the upcoming webinar: Modeling Flash Lidar in OpticStudio, Part 2: Lidar Simulation in Non-Sequential Mode. Any questions received during the webinar will be responded to as a reply on this thread. Feel free to post your own questions! The speaker will be notified and will respond as long as the thread is still open.

Be sure to subscribe to this thread if you want to see additional discussion regarding this webinar topic. The thread will be open to new replies for a limited time following the event.


>The webinar has concluded]


Webinar details

Date: Thursday, August 18th

Time: 6:00 - 6:45 AM PDT | 11:00 - 11:45 AM PDT

Presenter: Angel Morales, Senior Application Engineer at Ansys Zemax

Abstract:

In the consumer electronics space, engineers leverage lidar for several functions, such as facial recognition and 3D mapping. While vastly different embodiments of lidar systems exist, a flash lidar solution generates an array of detectable points across a target scene using solid-state optical elements. This technology enables compact packaging, and it has allowed detailed spatial data acquisition to be more commonplace in consumer products, like smart phones and tablets. In part two of this webinar series, we will cover the conversion of our sequential starting points from part one and incorporate additional detail into the non-sequential model. We also apply the ZOS-API to generate time-of-flight results with our flash lidar system.

Watch the recording!

To access the recording of this webinar, click here: Modeling Flash Lidar in OpticStudio, Part 2: Lidar Simulation in Non-Sequential Mode


Hi everyone -- we have collected some questions coming from the webinar that we did not get to.

Please feel free to post additional questions to continue the conversation, and thanks again for attending!

P.S. I have attached the demo files (all except those demonstrating the dynamic RCWA link, as that will require a valid Lumerical license when fully released) as a .ZIP folder to this post.


@bspokoyny 

Q: When using importance sampling, is the power reaching the detector actually meaningful? Or is it artifically "high"?

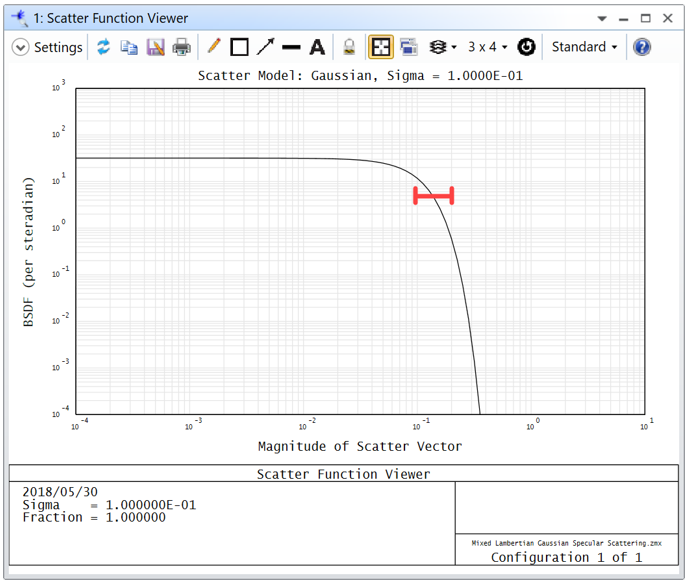
A: Importance Sampling is a method for sampling scattered rays from a surface scatter definition, which takes into account the actual scattering profile defined on the surface. It improves the signal that the target object receives (the target which you are “aiming” scattered rays at) by having OpticStudio selectively trace rays within a cone originating on the scatter location which will subtend the scatter target. The power of these scattered rays will be attenuated to match the power contained in that specific solid angle of the BSDF/other scatter profile you have on the surface.

The main detail to keep in mind is that while OpticStudio will use the scatter profile defined on the surface, all scattered rays carry the same flux within the scattering solid angle, as it will take the average power within that solid angle. So it’s best suited for scatter profiles where the range of scattered ray vectors measured from the surface normal (shown on the plot below as the region between vertical red bars) does not have a rapidly changing scatter function or if it’s an adequate approximation to take the average scatter function value within that range of scatter vectors. The average scatter function value is shown as the horizontal red line in the chart below:


For more information, feel free to take a look at the article here: How to use importance sampling to model scattering efficiently – Knowledgebase (zemax.com)


@Koan 

Q: What is "The importance of sampling" really doing? Choosing which rays are scattered the rays which really are going towards the sensor? and forgetting the rest of them?

A: Thanks for the question! I think this has been answered in the prior post. You are more or less correct, though – Importance Sampling will select only rays that scatter towards your defined target, and rays outside this target won’t be traced.


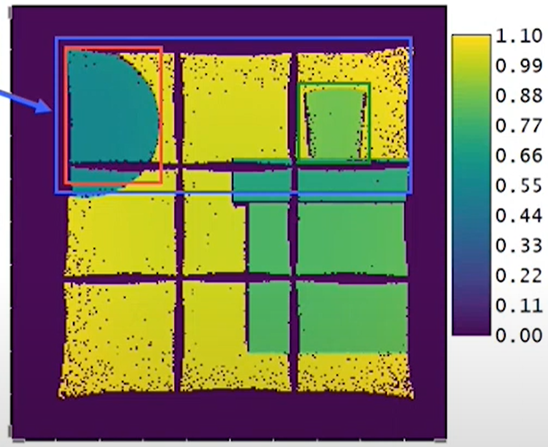
Q: In the more enhanced image Angel showed, there were dark grid marks on the image that were not present in the scene.  What made those marks?

A: Just to make sure, you were referring to this part of the presentation?:


This is coming from the size of my extended source and the diffraction angle from my “2D grating” (the crossed linear grating objects). I just didn’t size my source large enough to have overlaps in the boundaries from the diffraction angle, so these gaps could be quickly filled in by adjusting the grating’s period or by making the source larger.


Q: Why did Angel need to use an "extended source"  to generate a more detailed image of his scene?  The actual source is a grid of LEDs...

A: This was purely for demonstration purposes 🙂 I thought it might be a bit tough to see the pattern with just the dot pattern and relate it to the actual scene, so this was added just for better visualization!


@Hui.Chen 

Q: does ZOS calculate optical path length of each individual ray?

A: Yes, OpticStudio keeps track of the optical path length of each ray in both sequential and non-sequential tracing modes. This path length tracking is what enables the API solution used in this webinar – you can read more about the Time-of-Flight User Analysis here: How to create a Time-Of-Flight User Analysis using ZOS-API – Knowledgebase (zemax.com)


Q: When will we be able to access the presentation slides??

A: We do not provide presentation slides themselves, but please feel free to revisit the recording, as well as the attached Part 2 files at the top of this post!


@madeleine.akeson_01 

Q: Will the Lumerical solver be included in all OpticsStudio versions? Where can I find the webinar about the Lumerical solver DLL?

A: The Lumerical solver is separate software that you will need a license to run. By running the Diffractive DLL in OpticStudio which connects to Lumerical, it will look for a valid Lumerical license to finish the calculation. So it would be a separate procurement to OpticStudio.

For some more information, here is the webinar for the RCWA dynamic link functionality: >Webinar] AR waveguide design and optimization based on dynamic linking between Zemax OpticStudio and Lumerical RCWA Q&A] | Zemax Community


@Mansour Das. 

Q: could you please send me the recording for the part 1 and part2?...Thanks

A: Please see the first post above for the on-demand Part 2 recording. For Part 1, you can refer to this thread: >Webinar] Modeling Flash Lidar in OpticStudio, Part 1: Lidar Component Setup in Sequential Mode Q&A] | Zemax Community


@Mansour Das. 

Q: whats is the advantage of the NSM to the sequential design?

A: Defining such a system in sequential versus NS mode really comes down to the particular part of the design process you are in. Sequential Mode will be best used for measuring image quality of your respective systems, and you could also do a fair bit of optimization for the shape of the output beam using a method like described here: How to design a Gaussian to Top Hat beam shaper – Knowledgebase (zemax.com)

Non-Sequential Mode would be better suited for more thorough stray light analysis, incorporating housing of the lidar to gauge your system performance, and also to use enhanced functionality, such as the Time-of-Flight User Analysis or upcoming RCWA link as mentioned in this webinar.


@Niv.Shapira 

Q: Thank you!

A: Thanks for attending! 😊


Q: How is spatial information in x,y, and z extracted?

A: In non-sequential ray tracing, you can save the executed ray trace in full detail as a Ray Database File (.ZRD extension). This includes global XYZ intercepts on all objects a ray interacted with, the path length of the ray segment, direction cosines of propagation, and so on. So, you can use the .ZRD file to extract this information if you’re post-processing the ray database information (I already linked to it above, but here’s that time-of-flight article again for convenience 😊).


Q: Can the software handle optical phase sensitive/coherent LIDAR?

A: In general, OpticStudio tracks not just the phase of rays as they travel through an optical system, but also details like the electric field components in XYZ – this is true for both sequential and non-sequential modes. You can access all this information through the ray database, and if you have a Detector Rectangle object in your system, it will also be able to perform a Coherent Irradiance output (you can take a look at the Advance features section of this article for more information: Exploring Non-Sequential Mode in OpticStudio – Knowledgebase (zemax.com)).

Depending on your analysis needs, you may be able to use the Detector Rectangle object directly, or you could always do more thorough analysis of the ray data with something like the ZOS-API if needed.


Q: Does the system form 3-D images from return signal? And how does it handle interference from different objects in field of view?

A: The depth information shown in the Time-of-Flight user analysis is obtained by calculating the total path length of each ray segment landing on your specified detector. OpticStudio is not natively generating 3D images, but the demonstration shows how you can leverage existing data to compute desired results. As for different objects in the field of view, at this time, the demonstration User Analysis will report the average of the path lengths hitting the pixel, so it would change the reported distance depending on the number of rays that are coming from the different objects in the scene.


Q: Does the software calculate the Signal-to-Noise-Ratio (SNR) for a certain transmitted power?

A: OpticStudio does not compute the Signal-to-Noise Ratio directly, but I think you can use results from Detector Rectangle objects to understand this kind of relationship. The one thing I’d mention is that OpticStudio directly reports flux data on the detector objects based on ray information. If you have information specific to the sensor that you are wanting to incorporate (such as a background response, “floor” response, etc.), you’d need to include that yourself with some additional post-processing of the detector data.


Q: Can you calculate maximum range and spatial resolution of the LIDAR?

A: We covered this question a bit in the Part 1 thread, but the long story short is that while we did not calculate the maximum range of this lidar, this is certainly something you could set up to further characterize the model, as you can directly specify the input power of your sources, define the reflectance for various objects in the scene, as well as generate for yourself the ratio of some incident beam’s area on your scene to an object that will scatter/reflect the beam. It would have the added benefit to considering any losses from optical coatings or absorption of the lenses themselves, if you have absorption data defined for those materials.


@Yilmaz.Sevil 

Q: Hello, unfortunately I didn't receive any link of recording of part 1. Did you share it?

A: Hi there – you can find the recording for Part 1 on the prior thread here. Thanks!


@Yisi.Liu 

Q: when will you post this video and the part 1, and the previous webinar "Cell Phone Lens: The Fundamentals Behind the Optical System Design"?

A: Please see above for Parts 1 and 2 for this webinar series! As for the other webinar you mentioned, you can access that on-demand recording here: "Webinar] Cell Phone Lens: The Fundamentals Behind the Optical System Design nQ&A] | Zemax Community


This thread is now closed. Thank you to everyone for asking such engaging questions. And thanks to @Angel Morales for a great webinar series!