OpticsTalk: Simulate the final imaging result - all you need to know about Image Simulation


Userlevel 1

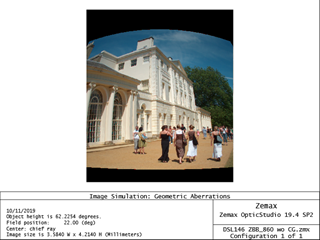
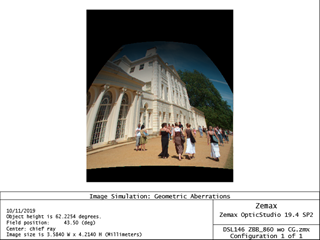
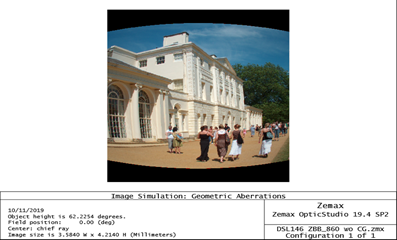
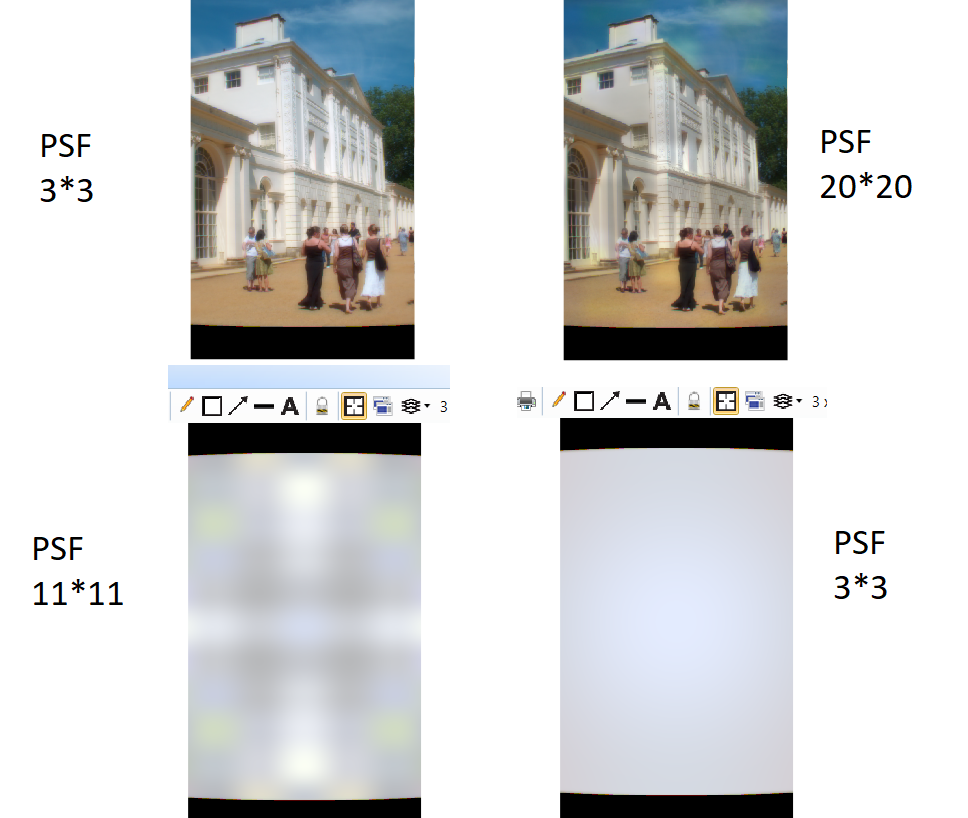
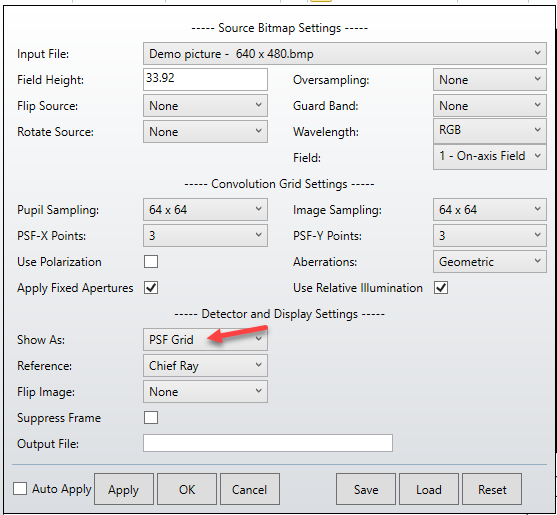
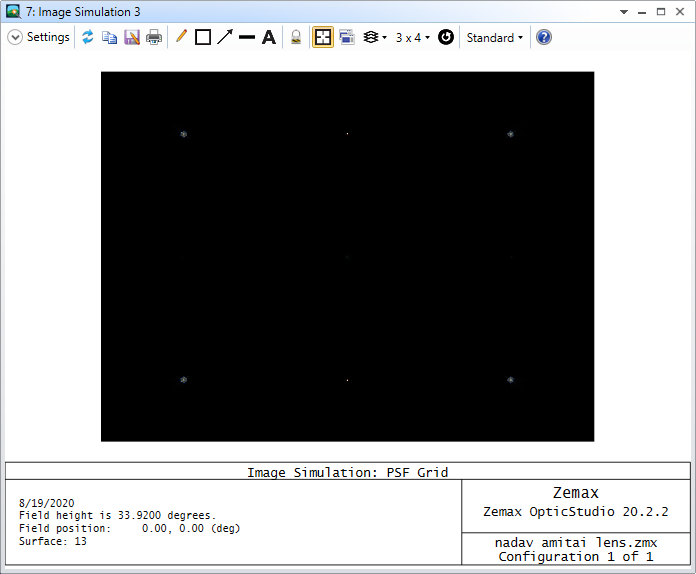
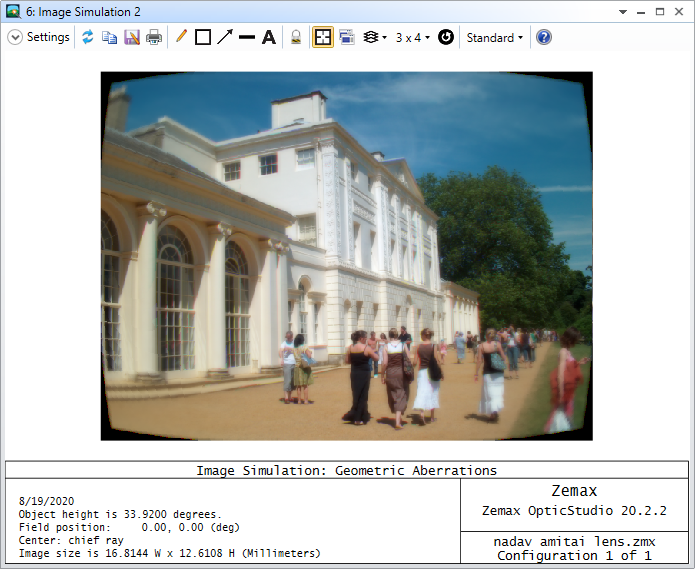
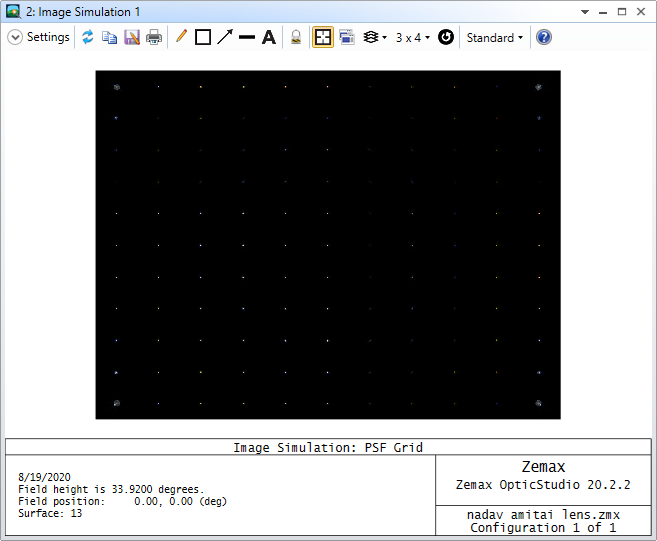
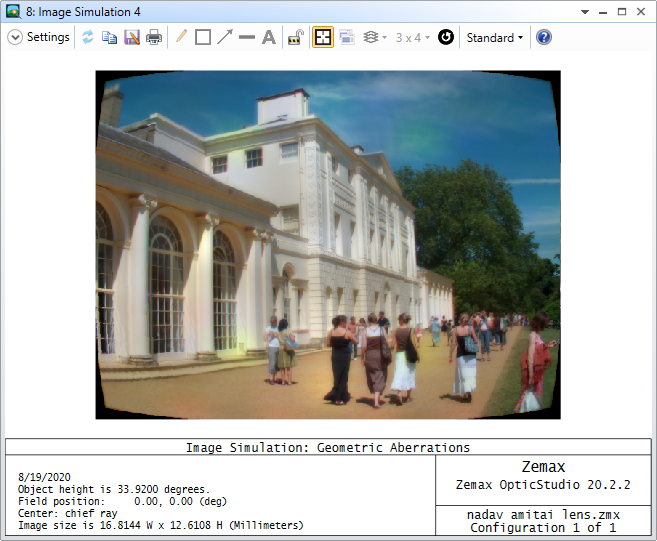
Image Simulation is an extremely powerful tool to generate a simulated final image for evaluating the imaging quality of a lens system. Due to its complex nature, it's not easy to get all the settings correct. In this talk let's dive into what’s happening behind the screen and the correct way of simulating a proper image.


12 replies

can you explain more on the field position setting? In my understanding, the image itself contains different field of ray traces already. When I set different field positions, the simulated image look different for each field position. It would be helpful to know the effect of how field position setting really affect the simulation. 


what is the rule of thumb for properly selecting convolution grid settings such as # of sampling and PSF points?

To answer Tzu-Yu's question, changing the Field setting will center the image about the selected field. One scenario where this could be helpful is if you want or need to break the analysis of the full FOV into smaller pieces.

To answer Abdurahim's question about selecting convolution grid settings, there are three effects you need to try to balance.


1. PSF variation -- Ideally, you don't want the PSF to change drastically between PSF grid locations. If the shape of the PSF is dramatically different between neighboring grid locations, the 2D interpolation scheme could introduce unphysical artifacts.


2. PSF resolution -- If your detector has high enough resolution so that the PSF spread is important, then the input image resolution (which would include any oversampling applied) should be high enough so that on the PSF grid you see some resolution of the individual PSF's on the PSF grid.


3. Speed -- Clearly if you keep cranking up the input image resolution and the # of PSF's on the PSF grid, then the calculation speed will increase. Because of this, in many cases you will need to try to balance the effects you want to capture versus the overall calculation speed so that the calculation time is acceptably short.

Userlevel 1

Hello Shawn,


I got acceptble mtf in my lens (attatched here), but when using the image simulation i started to see a lot of chromatic aberrations while utlizing the image simulation and increasing the psf points:


How can I distinguish between unphysical artifacts and real chromatic aberrations?


Best regards,


Nadav

Userlevel 5
Badge +1

Hi Nadav,


Thanks for your follow-up post here!


I took a look at your file, and I think to accurately speak to the images that you've shared, I might need to see all of your settings for the Image Simulation analysis. However, I would say that it is important to consider what is happening as you increase the number of PSF points in the Image Simulation settings. What you're really doing is sampling your field of view and generating PSFs (either geometric-based or diffraction-based) at each of those sample points. So, what could happen is that with less PSFs being sampled, you're undersampling the aberrations in your system. We can check the PSFs by looking at the 'PSF Grid' output:


The resulting grid is as follows:


So, we can see that with these settings, the PSFs at the corner of your field of view are really the most noticable, with your axial PSF and X- or Y-only fields being comparably much smaller. The resulting simulated image is as follows:


When we go to a higher PSF grid samplng, like 11x11, we can see the chromatic effects start to become more obvious as the edge of the field of view due to the higher field sampling:


Again, since Image Simulation generates results based on the interpolation of this PSF grid to create the output image, it's important that the look of the PSFs don't change dramatically across a single point. If that happens, then the interpolation won't be as accurate as having higher sampling:


Please let us know how these thoughts work out for you and if you have any more questions here. Thanks!


~ Angel

Userlevel 1

Hi Angel,


Thanks for the quick answer.


When I changed the the sampling from, let's say, 29*29 to 30*30 I  see very different kind of  chromatic aberrations(change of color and/or location).


If it is real effect shouln't we see some convergence of the image details while increasing the sampling?


Best regards,


Nadav


Userlevel 5
Badge +1

Hi Nadav,


Thanks for your follow-up!


I think one of the main issues is the color error changing throughout your field of view. It seems like the resulting PSFs might be quite sensitive to their placement in your field. If we compare the same areas of your field with the PSF grid, I think we can see this effect:


Since you have Even Asphere surfaces with some higher order terms defined due to set as variables, I think one of the limitations of this tool that you'll find is how the field of view performances changes across it. So, I am not too surprised to see the color effects changing as we adjust sampling. As you mentioned, I think there should be some point of convergence, but the catch here might be that we need much higher sampling to arrive at that convergence. I think there might be two approaches you could take:


  • You could steadily increase your PSF sampling in X and Y until there is some point of convergence (though, as I said, I am not sure what point this would occur)

  • You could break down your Image Simulation analysis into discrete FOV 'chunks' by changing the Field Height and Field settings in your Image Simulation settings


Like Shawn mentioned a few posts ago, we can center the Image Simulation analysis on different points. We can then reduce the Field Height value so that we actually take up a smaller portion of the field of view. This has the benefit of then having a higher concentration of PSF sampled points in a certain part of the image, meaning we may not need as high sampling to get a decent convergence of results.


Please let us know if you have any more questions here!


~ Angel

Userlevel 3
Badge

Just curious, what is the backstory of the Demo picture? Where was is it taken? 

From what I've heard, this demo picture was contributed by a former employee from their personal photo collection. I don't actually know where the photo was taken. Since the photo is both beautiful and includes a variety of details that are helpful with assessing image quality, it has become the most popular choice for our image simulation examples.

Userlevel 2
Badge

On the subject of processing time I have often thought that it would be useful to have an option to limit the image to a quadrant.  Most imaging systems are rotationally symmetric so when we simulate an image like that sample image, which covers the full field, we are calculating the same aberrations multiple times radially.  By limiting the image to one quadrant you get all the information you need (vignetting, distortion, aberrations) in one quarter of the processing time.  Once you are happy that the settiungs are right you can then run a full image to present to customers etc.


A feature request perhaps?

Userlevel 5
Badge +1

Hi Ian,


Thanks for your post here! I think your idea is an interesting one, certainly. Like you said, most imaging systems are rotationally symmetric, and for those that aren't, there could also be a setting to ensure that the analysis isn't assuming rotational symmetric or vice versa. I think there would obviously need to be some considerations for implementing this kind of adjustment to the PSF evauation -- for example, sometimes we apply the Image Simulation tool to a field other than the axial point -- but I think it's at least worth considering ways to identify when we can leverage rotational symmetry for this analysis.


I'll happily bring this up with our Product Team as a feature request, so thanks for your feedback! Please let us know if you have any other questions or comments, and we'll be happy to continue the discussion here.


~ Angel

Reply