Hello,
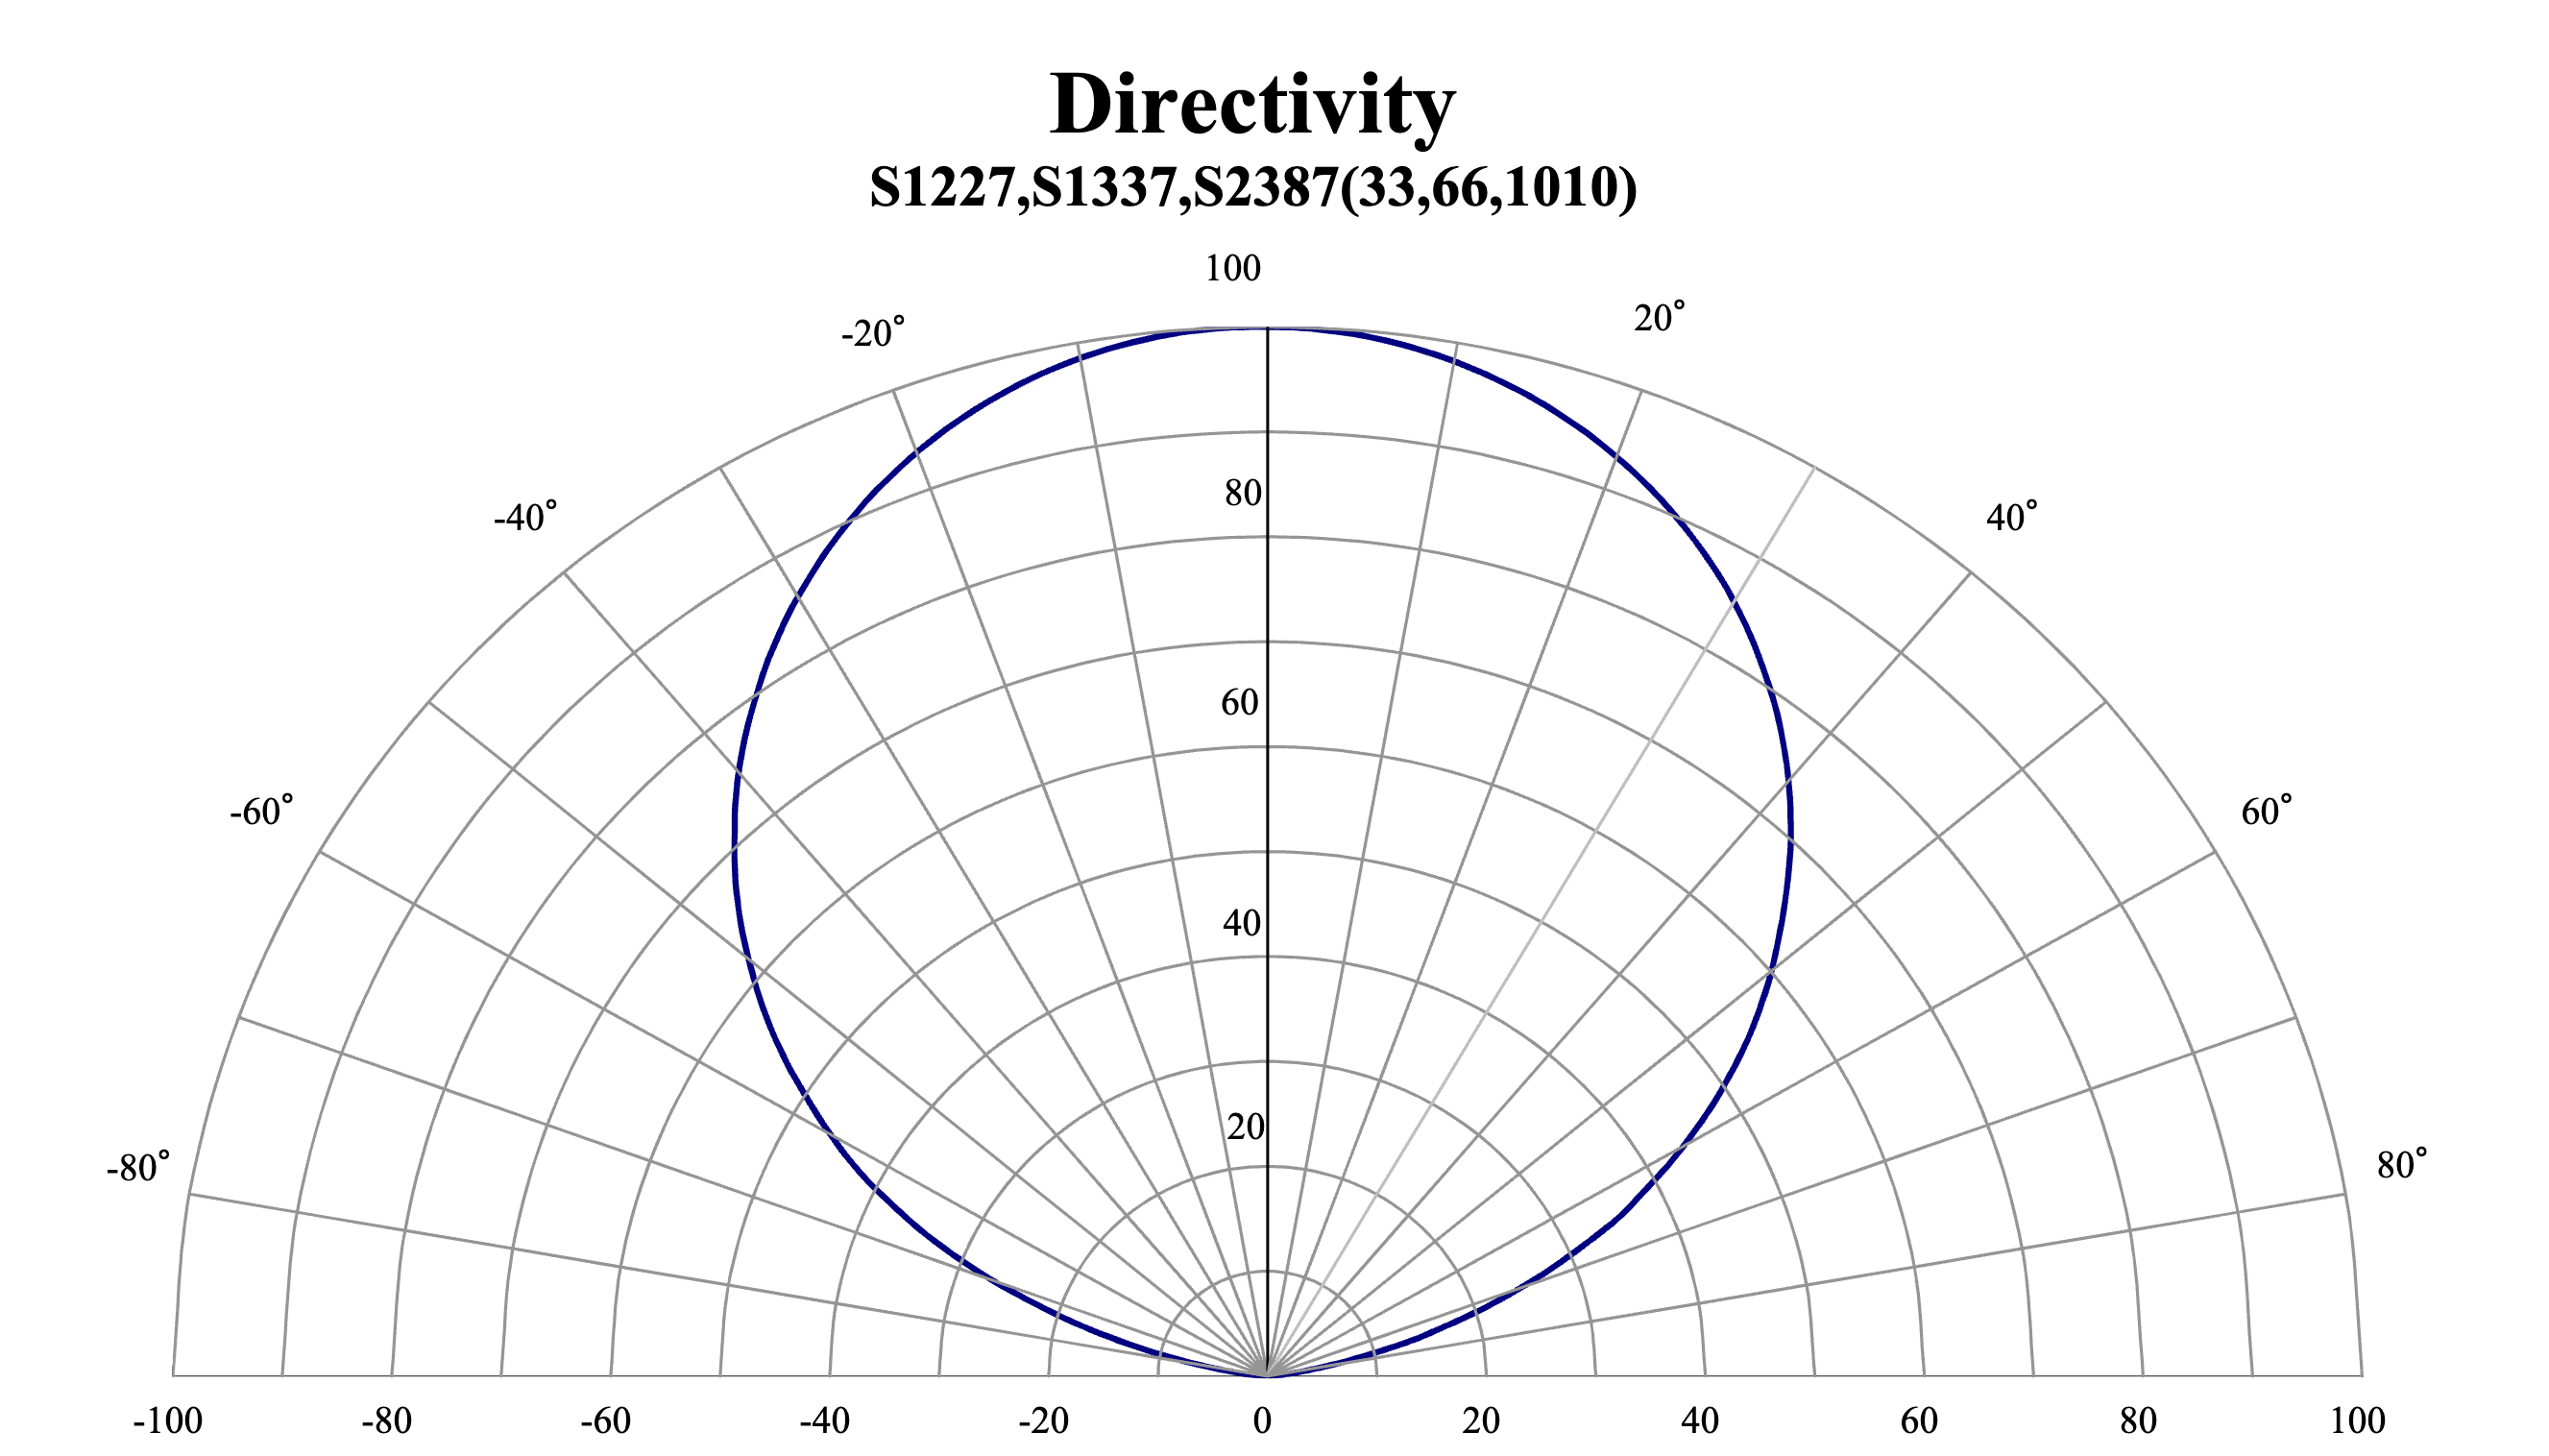
For a silicon photodiode detector, there’s a given Directivity plot that describes the amplitude change in amount of light that the detector sees at a specific angle relative to the normal axis.
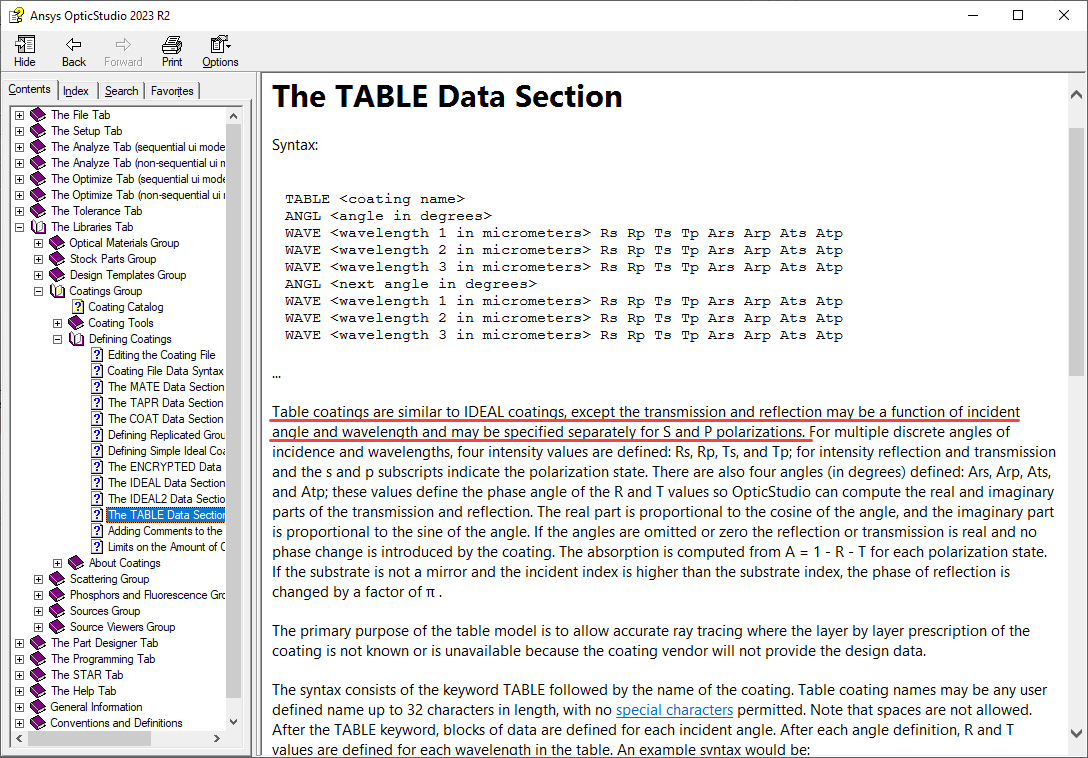
I would like to know how to apply this Directivity for a Detector Rectangle object in Non-Sequential Component mode.

The results of the simulation are meant to show how much light the photodiode fails to detect due to non-collimated light.
I’ve attached ZAR of a simple source gaussian non-collimated light onto a detector rectangle.


