Solved

Simulating Response of Detector By Applying Directivity Constraint


Hello,

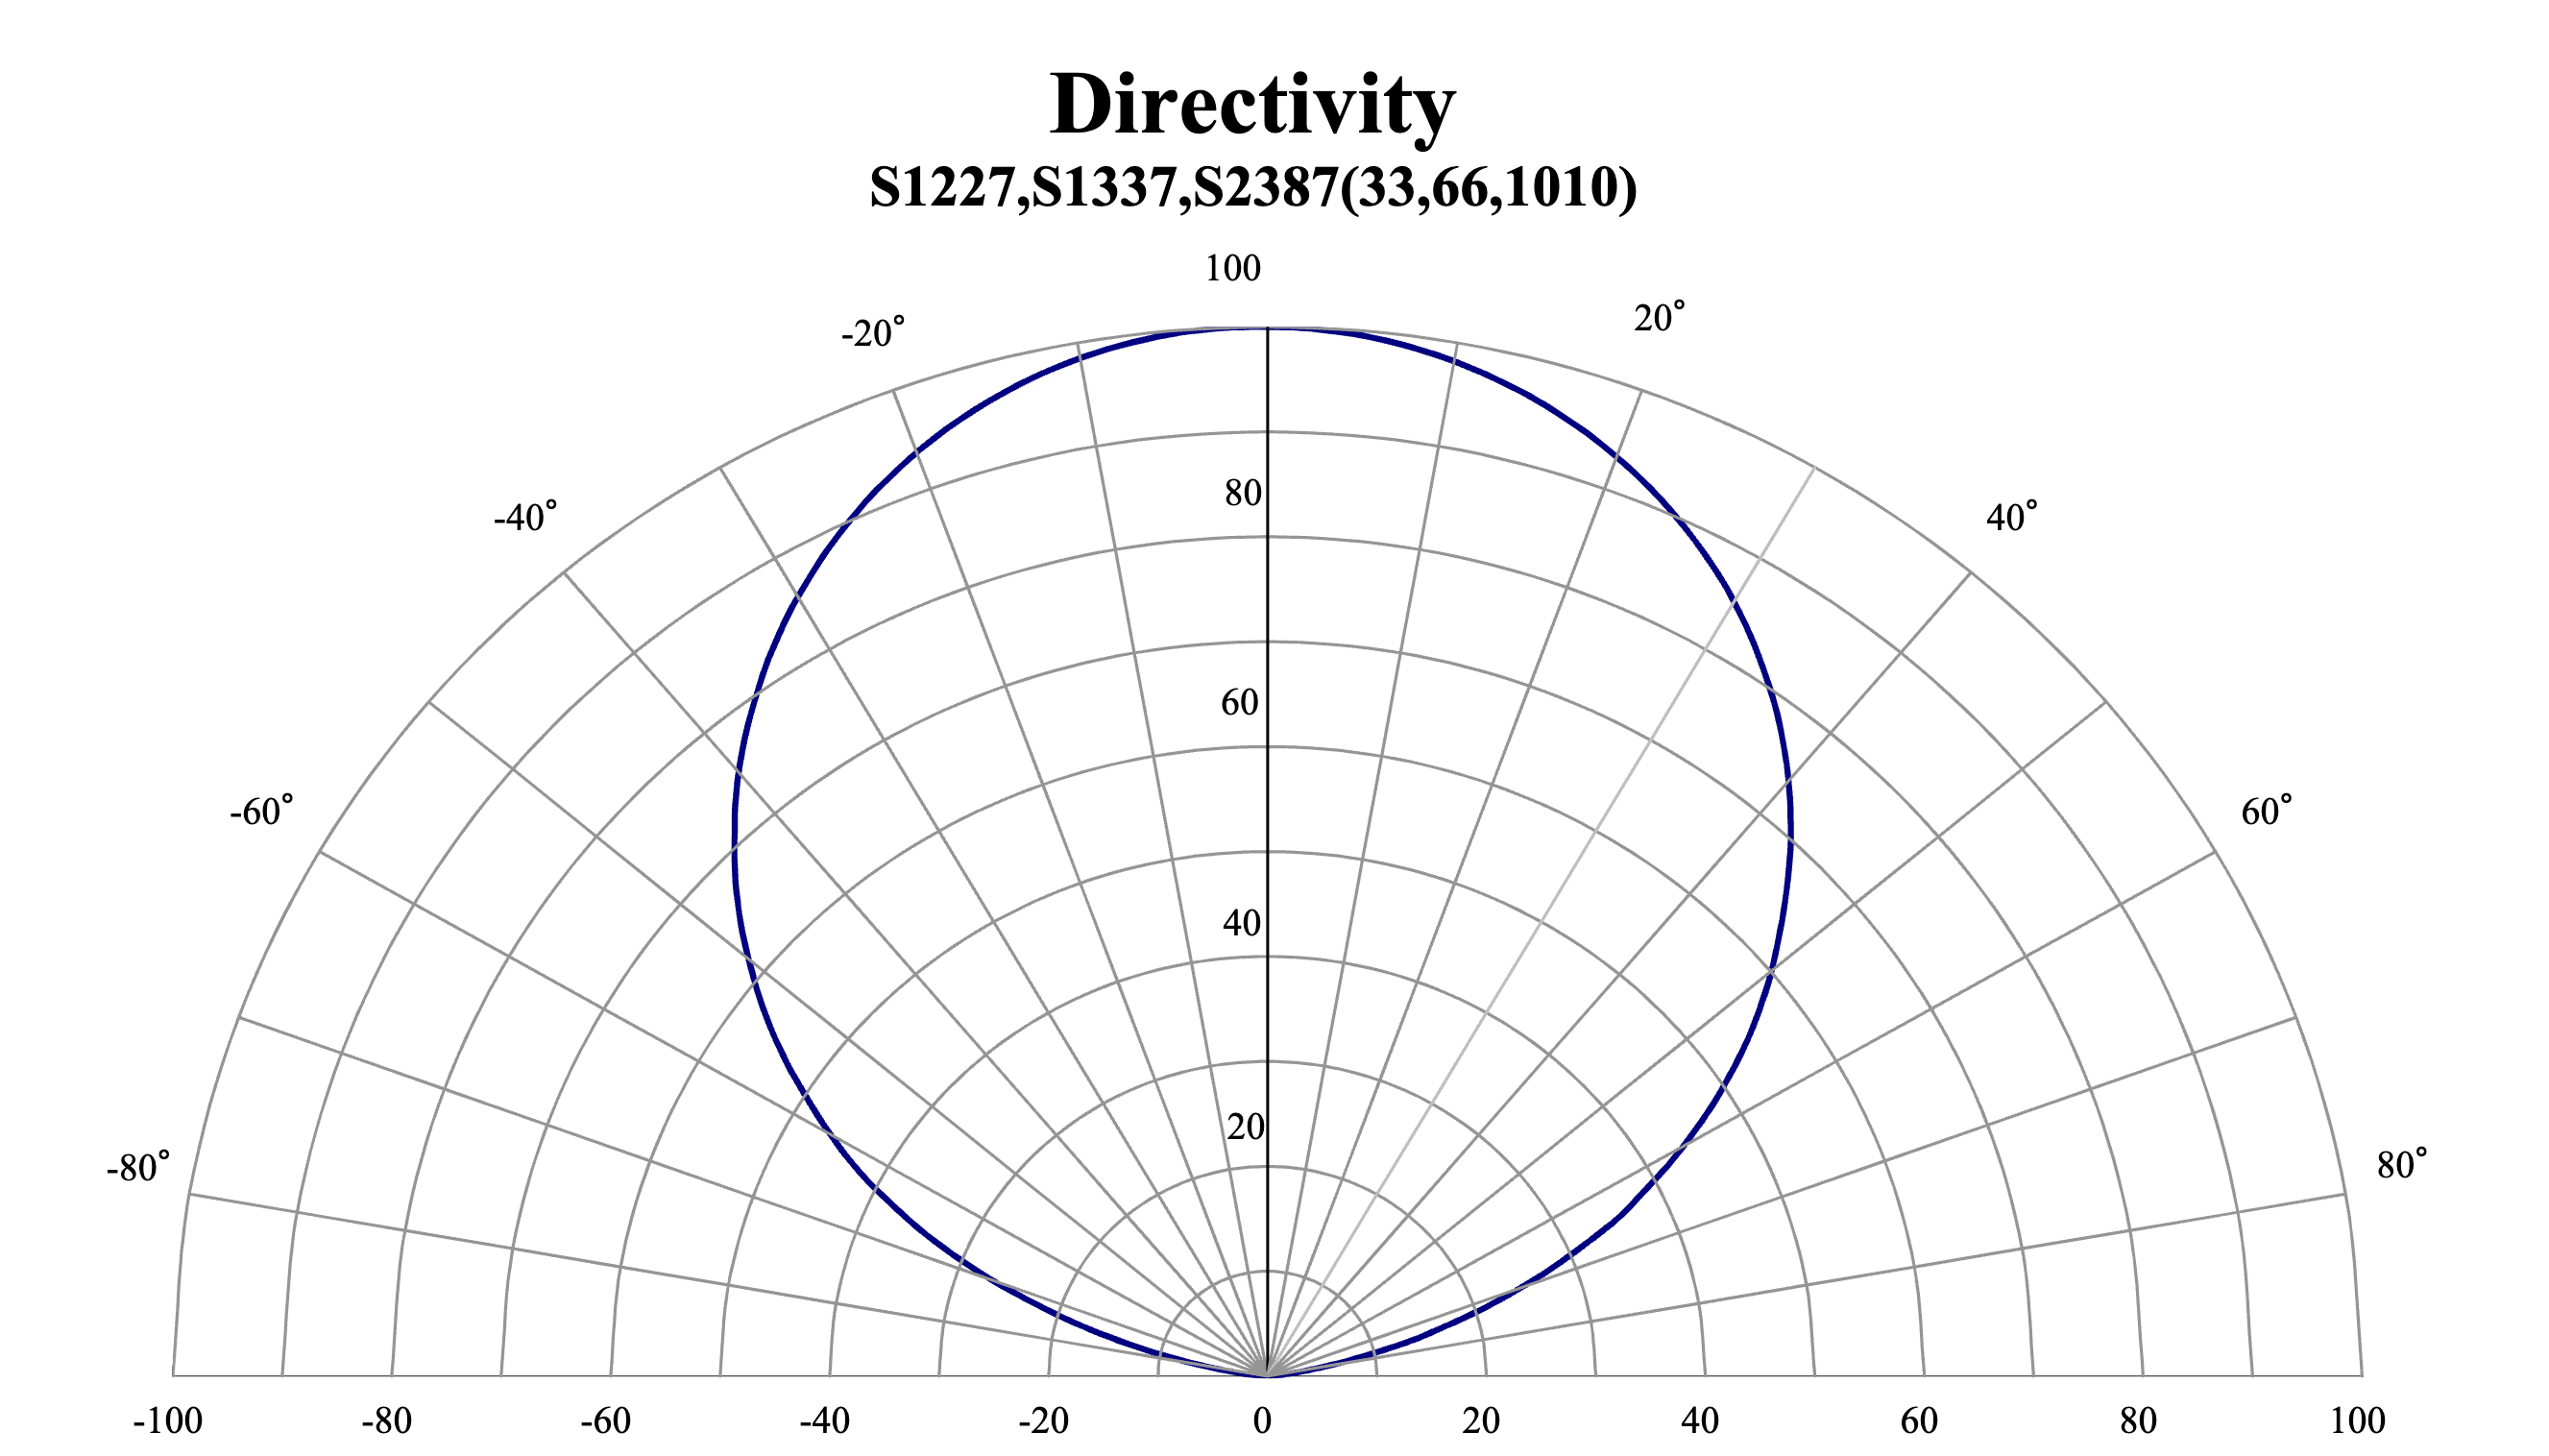
For a silicon photodiode detector, there’s a given Directivity plot that describes the amplitude change in amount of light that the detector sees at a specific angle relative to the normal axis.

I would like to know how to apply this Directivity for a Detector Rectangle object in Non-Sequential Component mode. 

The results of the simulation are meant to show how much light the photodiode fails to detect due to non-collimated light.

I’ve attached ZAR of a simple source gaussian non-collimated light onto a detector rectangle.


Best answer by Jeff.Wilde

You might consider using a thin mask (rectangular volume) placed in front of your detector.  You could construct a TABLE coating to put on one surface of this mask in order to mimic your directivity curve.  This related post may be of some help:


Regards,

Jeff

View original
Did this topic help you find an answer to your question?

2 replies

Jeff.Wilde
Luminary
Forum|alt.badge.img+3
  • Luminary
  • 490 replies
  • Answer
  • November 7, 2023

You might consider using a thin mask (rectangular volume) placed in front of your detector.  You could construct a TABLE coating to put on one surface of this mask in order to mimic your directivity curve.  This related post may be of some help:


Regards,

Jeff


As a follow up, is there a way to generate a distribution map/list/values showing representation of incident angles of rays to the detector normal surface? I want to be able to plot a histogram distribution of incidence angle of the detector surface.


Reply


Cookie policy

We use cookies to enhance and personalize your experience. If you accept you agree to our full cookie policy. Learn more about our cookies.

 
Cookie settings