Is it possible to plot multiple PSFs in zemax in one window using macro?
Best,

Is it possible to plot multiple PSFs in zemax in one window using macro?
Best,
Best answer by Jordan.Teich
Hi
Mike has a great suggestion! It sounds like you’ve already used a ZPL macro to adjust an object distance in your Lens Data Editor and then extract a PSF for each distance. With the ZPL itself, I don’t believe there is a method to place all of those extracted PSF’s within a single window. If you wanted to accomplish this via scripting, I would recommend using something like Matlab to place each PSF into a single graphic.
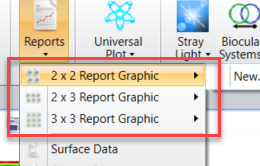
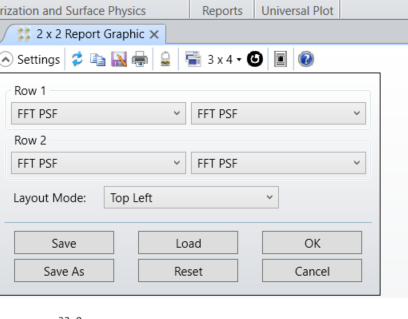
But as Mike mentioned, you can also accomplish this with the report graphic feature and without using a macro. You would want to do the following to get it to work:
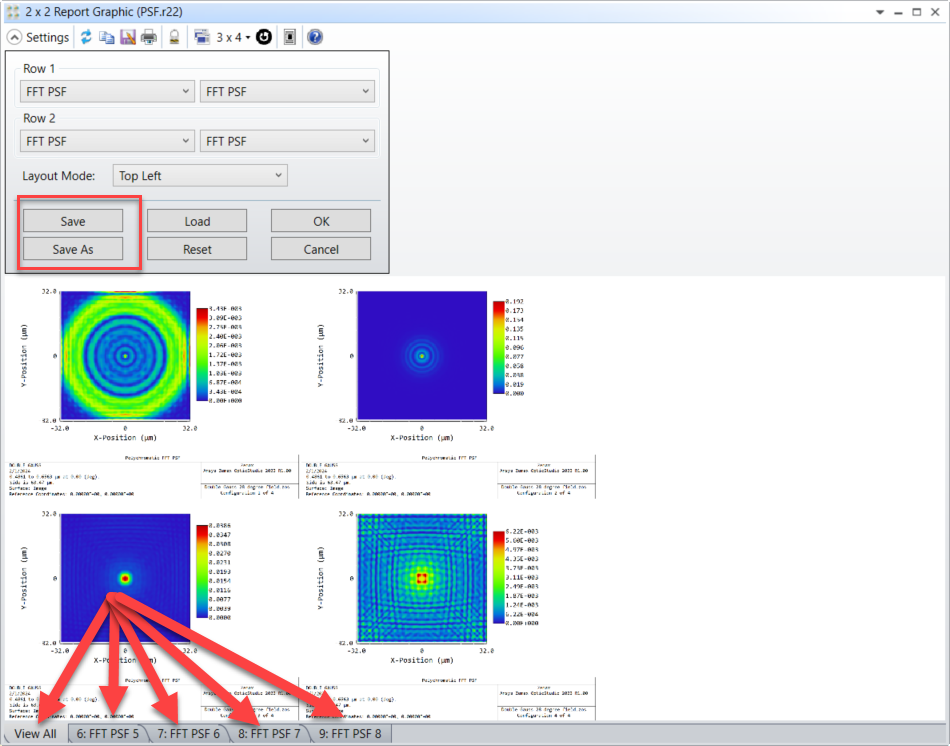
I’ve attached a ZAR file that I put together using this feature so that you can look at an example. I hope this helps!
Enter your E-mail address. We'll send you an e-mail with instructions to reset your password.
Do not provide any information or data that is restricted by applicable law, including by the People’s Republic of China’s Cybersecurity and Data Security Laws ( e.g., Important Data, National Core Data, etc.).
不要提供任何受适用法律,包括中华人民共和国的网络安全和数据安全法限制的信息或数据(如重要数据、国家核心数据等)。
