
Hi,
In my spectrometer design, I want to understand how much percentage of incoming power will be detected at each wavelength and if that is above sensitivity of my detector. I have used the geometrical image analysis for that. However, I cannot make sense of the numbers here.
If the total power through the entrance pupil is 9e-15 over the 3mm width of the detector (which covers 250nm to 350nm wavelength) with 231pixels in each axis (sice the detector pixel size is 13um), I donot understand how come the irradiance power at each wavelength is higher than the total power! I assume image width is only in the width in x-axis or y-axis. let me know if that is also not a correct assumption.
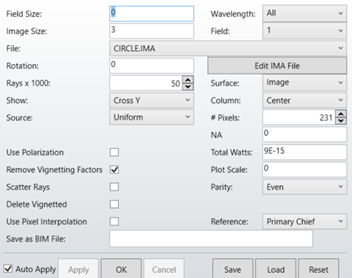
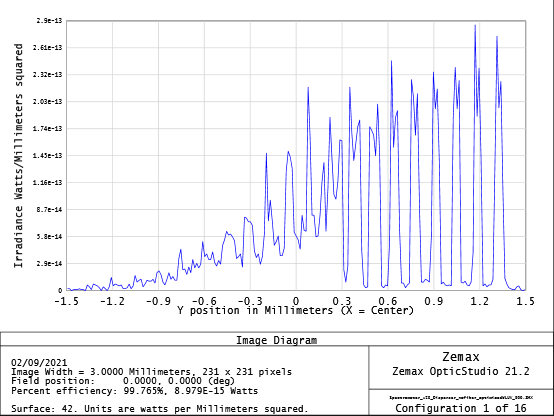
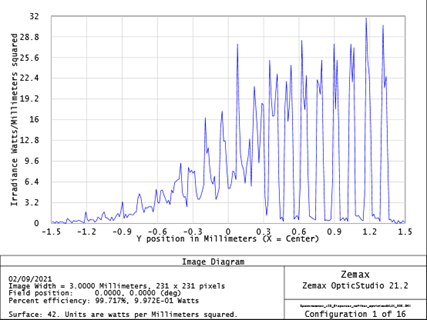
I set the total power to 1(equivalent to 100%), to have the outcome of the irradiance in fraction of Watts/mm^2, but I have the same issue.
Secondly, I would like to know when my detetcor is not along global Y-axis, looking at the Cross Y is correct. Meaning is the Cross X and Cross Y in the image analysis is along the spectra on the detector, which will be Global_y * cos(angle between detetcor and global y-axis) ?
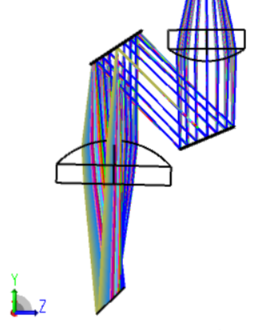
If looking at the geometrical image analysis is not the way to go, please let me know. I am looking at the geometrical analysis, since my system is limited by geometrical errors rather than diffraction.
Thank you in advance
