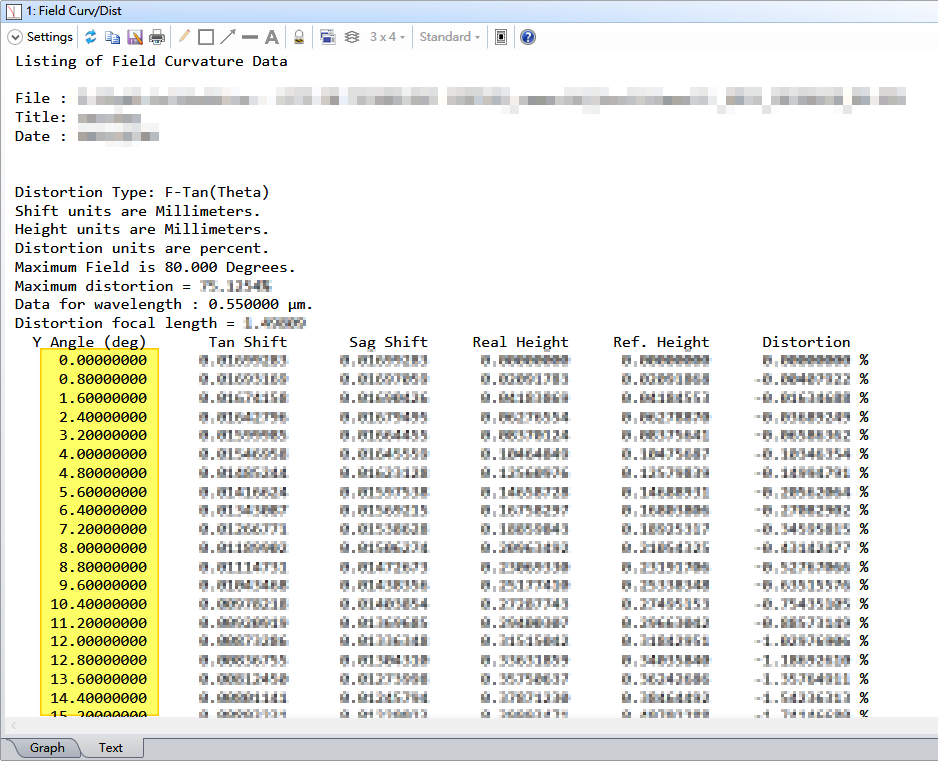
The "Y angle" interval is 0.8 (degrees), as shown in the figure below. But I want to get the data "Y angle" interval is 0.1 (degree).
The maximum field keeps 80.0 degrees.
How can I get the data "Y angle" interval is 0.1 (degree)?
Thank you!
Anna
Best answer by Mark.Nicholson
Hey Anna,
The FC/D plot does not let you select the data interval, so if you need the data on some specific grid you’ll need to write a macro. I’d probably use the DISG operand to compute the distortion at the desired field.
The FC/D plot does not let you select the data interval, so if you need the data on some specific grid you’ll need to write a macro. I’d probably use the DISG operand to compute the distortion at the desired field.