Coherent phase in NSQ mode

  • 16 October 2020
  • 2 replies
  • 182 views

Hi all,


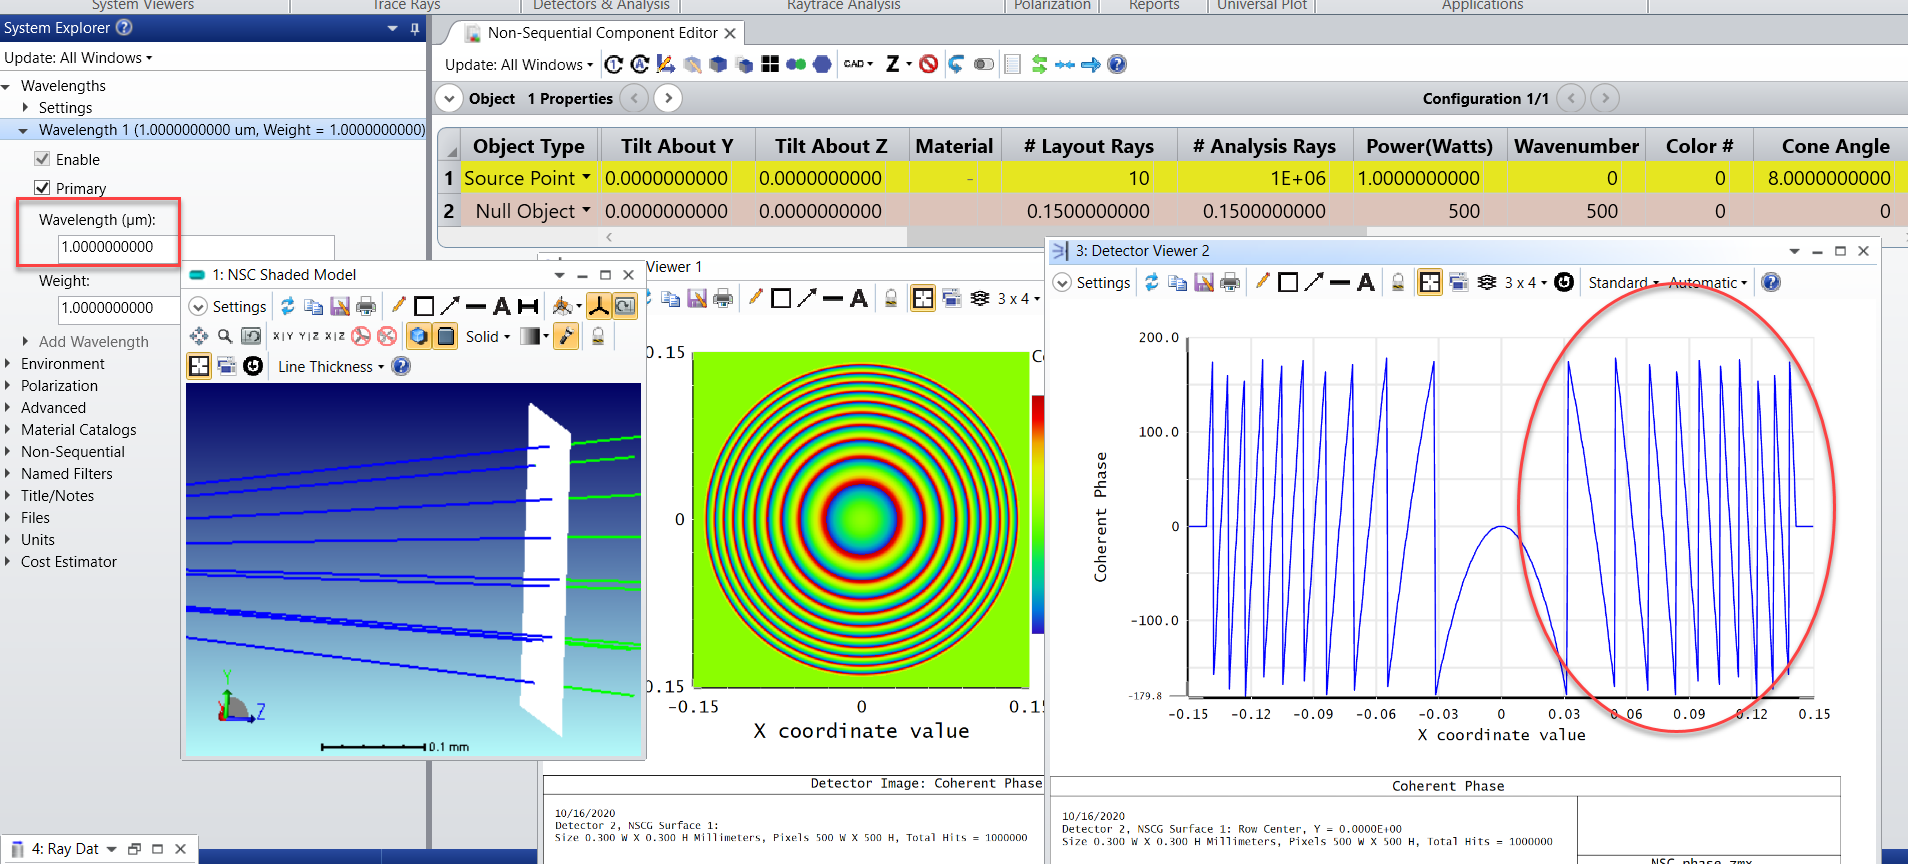
When I see a coherent phase in the detector rectangle, the detector viewer shows discontinuous wrapped phase data.


I think it is not intuitive to check the phase whether it is right or not because it looks like noise. 

(But we can check continuous wavefront in SQ mode!) 


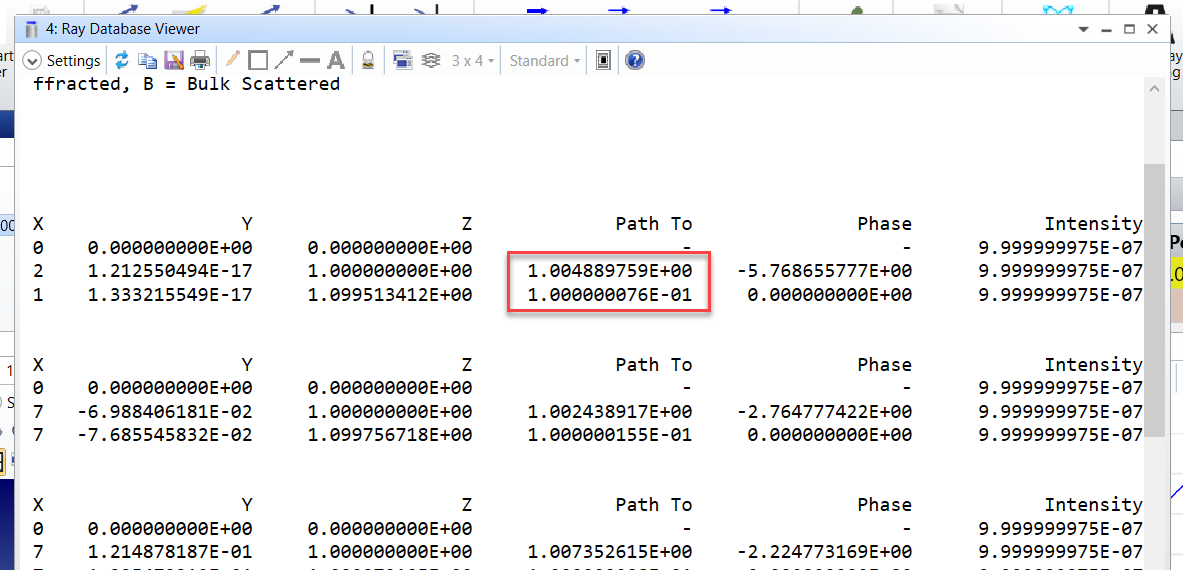
Because the phase is discontinuous, it is necessary for more numerous data relative to unwrapped(continuous) data to represent the complex phase.  


In this situation, how do you use this 'coherent phase' function in the detector viewer?


Are there good examples to understand it?


Can I see the spherical wave or plane wave data with a 'coherent phase' at the detector rectangle in the simple lens system? 


Thanks in advance.


2 replies

Userlevel 4
Badge +1

Hi Jeeyoung,


Thank you for your post!


Yes, I think your understanding is correct. In Sequential mode, you can choose the phase plot to show the raw data (accumulated phase) or the 2pi wrapped phase. However, in NSC mode, the Coherent Phase plot from Detector Viewer will only display the 2pi wrapped phase. I suppose one way to deal with this, if you prefer to see the accumulated raw phase, is to do some post data processing yourself. For example, in the plot below, instead of looking at the False color Coherent Phase dispaly, I can set the Show As to Cross Section Row. Then I can count how many periods of 2pi have been wrapped and recover the continuous raw phase data by multiply the # of periods wrapped. For example, the screenshot below shows 10 fringes in the Phase plot, so the raw phase data will be about 10 waves or 20pi at the edge of the detector. 


During the ray trace if you choose to save a ZRD file, when you open the ZRD file in the Ray Database Viewer, you can see the Path To entry. This is the path length, physical, not the optical path length, from the parent segment being displayed. However, this data is only for a single ray. OpticStudio will also show the phase in radians, but only for segments striking a detector surface, and the phase data there is also 2pi phase wrapped.


I hope this helps clear things up a bit. Let us know if you have any other questions.


Best regards,


Hui


Userlevel 7
Badge +3

It's worth thinking about what you measure in real life too. IRL, an interferometer measures the wrapped phase, and the interferometer's software unwraps the phase to give you a continuous profile. But it is the wrapped phase that is measured, and this is why we use the number of fringes as the measure of quality of the wavefront.

Reply