Solved

Zemax API - Huygens PSF Output not matching TXT file


BeauDiddley

Hi everyone,


I created a Matlab script which can both output the results txt file via ‘GetTextFile’ and read the results of a Huygens PSF analysis directly. The problem is that these do not match.


Excerpt from my code:

newWin = TheSystem.Analyses.New_HuygensPsf();

...

newWin.ApplyAndWaitForCompletion();

newWin_Results = newWin.GetResults();

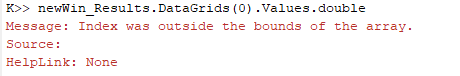
data = newWin_Results.DataGrids(1).Values.double;

newWin_Results.GetTextFile(outFolder)


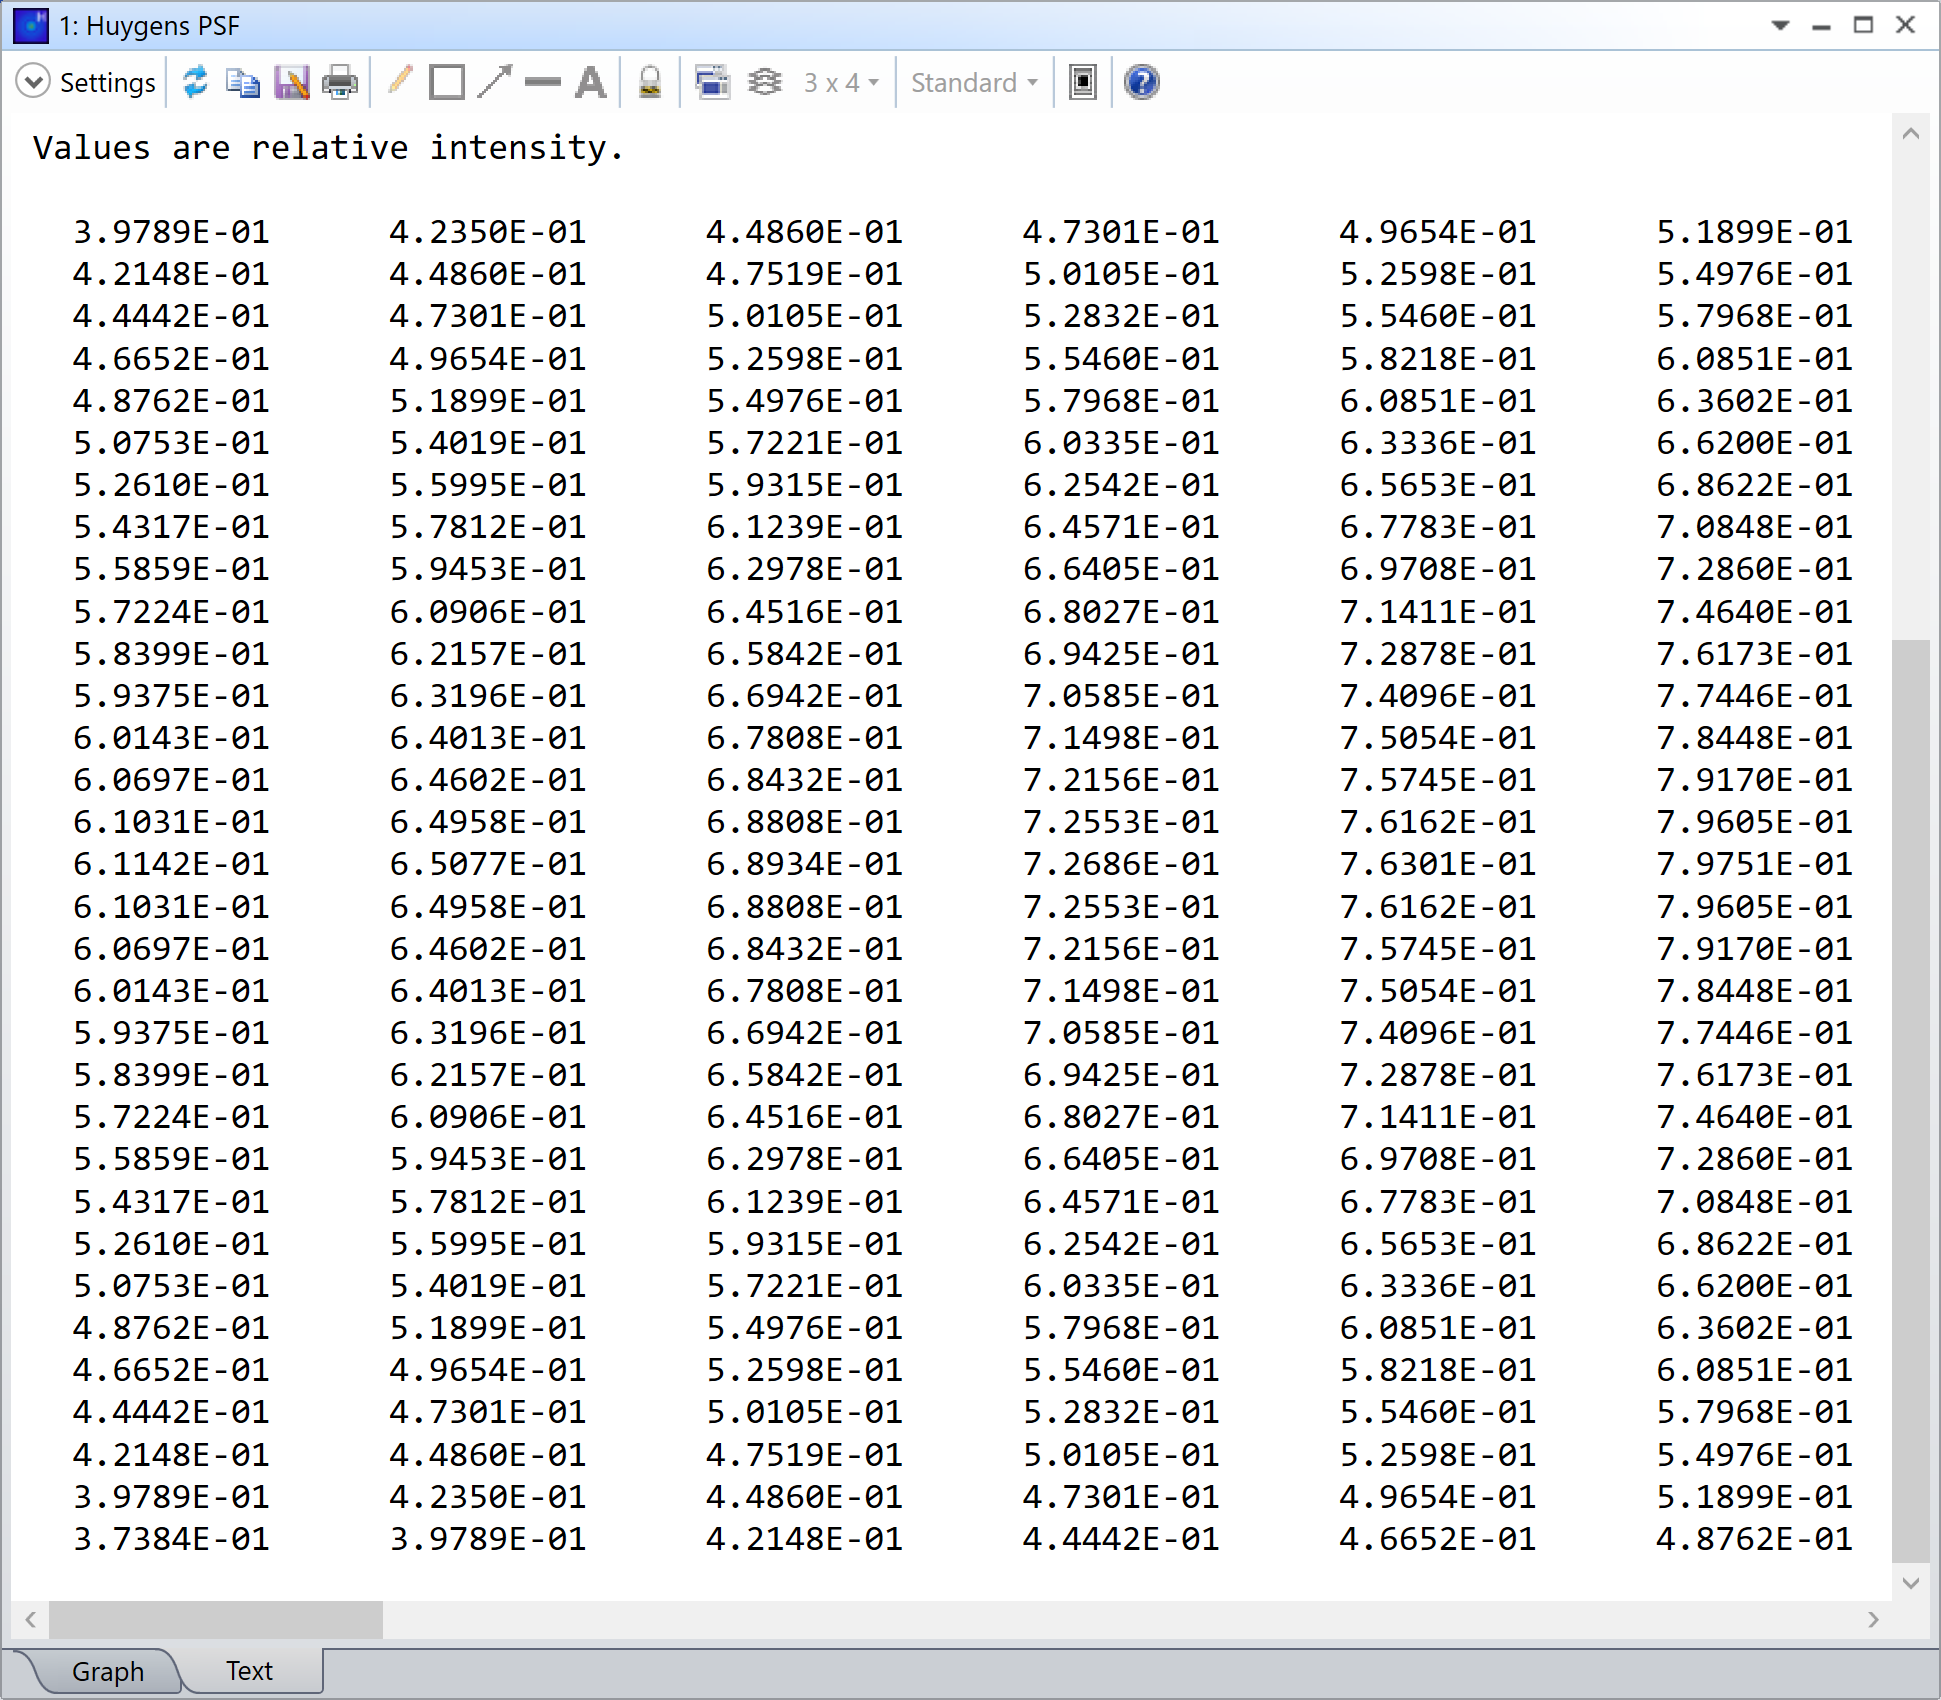
Txt File Data Snippet:

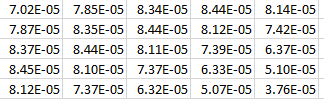
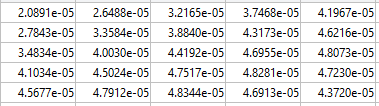
data variable above snippet:

Is “DataGrids(1).Values.double;” the proper way to extract this information from GetResults? The text file also matches what standalone OpticsStudio provides me so I am taking that data to be the truth.

Best answer by David.Nguyen

Oh dear, I had completely forgot about this peculiarity of MATLAB. Apologies.

When I try to do it in Python, it seems almost ok for me. But, I have to apply a transpose operation to the values! Also, for some reason, the first line is actually the last line. When I use this snippet in a default lens file:

import numpy as np

huygens_psf = TheSystem.Analyses.New_HuygensPsf()
huygens_psf.ApplyAndWaitForCompletion()
huygens_psf_results = huygens_psf.GetResults()

datagrid = huygens_psf_results.GetDataGrid(0).Values
npData = transpose(reshape(datagrid, datagrid.GetLength(0), datagrid.GetLength(1)))
npData = np.array(npData)

print(npData[:6, :6])

huygens_psf.Close()

I get this result:

[[0.37383706 0.39789254 0.42147975 0.44441609 0.46652057 0.48761576]
 [0.39789254 0.42349592 0.44860091 0.47301315 0.49654    0.51899261]
 [0.42147975 0.44860091 0.47519413 0.50105354 0.52597507 0.54975868]
 [0.44441609 0.47301315 0.50105354 0.52832018 0.5545979  0.57967578]
 [0.46652057 0.49654    0.52597507 0.5545979  0.58218263 0.60850784]
 [0.48761576 0.51899261 0.54975868 0.57967578 0.60850784 0.63602343]]

And this is the text output:

Can you confirm that you see the same? It could have to do with the Python reshape function in the boilerplate code, I’ll check that.

Take care,


David

View original
Did this topic help you find an answer to your question?

5 replies

David.Nguyen
Luminary
Forum|alt.badge.img+2
  • Luminary
  • 1089 replies
  • November 6, 2023

Hi @BeauDiddley,


I can see that you are using:

newWin_Results.DataGrids(1)

Usually, a simple Huygens PSF will return a single DataGrid at index 0. How did you have a second DataGrid at index 1? I’m asking because if the settings are different it could explain the discrepancy.

Take care,


David


BeauDiddley
  • Author
  • Monochrome
  • 3 replies
  • November 6, 2023

@David.Nguyen ,


Thanks for the reply. I believe this would be a case of Matlab indexes start at 1, not 0.


David.Nguyen
Luminary
Forum|alt.badge.img+2
  • Luminary
  • 1089 replies
  • Answer
  • November 6, 2023

Oh dear, I had completely forgot about this peculiarity of MATLAB. Apologies.

When I try to do it in Python, it seems almost ok for me. But, I have to apply a transpose operation to the values! Also, for some reason, the first line is actually the last line. When I use this snippet in a default lens file:

import numpy as np

huygens_psf = TheSystem.Analyses.New_HuygensPsf()
huygens_psf.ApplyAndWaitForCompletion()
huygens_psf_results = huygens_psf.GetResults()

datagrid = huygens_psf_results.GetDataGrid(0).Values
npData = transpose(reshape(datagrid, datagrid.GetLength(0), datagrid.GetLength(1)))
npData = np.array(npData)

print(npData[:6, :6])

huygens_psf.Close()

I get this result:

[[0.37383706 0.39789254 0.42147975 0.44441609 0.46652057 0.48761576]
 [0.39789254 0.42349592 0.44860091 0.47301315 0.49654    0.51899261]
 [0.42147975 0.44860091 0.47519413 0.50105354 0.52597507 0.54975868]
 [0.44441609 0.47301315 0.50105354 0.52832018 0.5545979  0.57967578]
 [0.46652057 0.49654    0.52597507 0.5545979  0.58218263 0.60850784]
 [0.48761576 0.51899261 0.54975868 0.57967578 0.60850784 0.63602343]]

And this is the text output:

Can you confirm that you see the same? It could have to do with the Python reshape function in the boilerplate code, I’ll check that.

Take care,


David


BeauDiddley
  • Author
  • Monochrome
  • 3 replies
  • November 6, 2023

@David.Nguyen ,


Haha! Happens to all of us! Transposing via flipud solved the issue for me, but my first line is in the correct spot… weird.


Thanks a lot! My PSFs are pretty symmetric, which made this difficult to diagnose on my own.


David.Nguyen
Luminary
Forum|alt.badge.img+2
  • Luminary
  • 1089 replies
  • November 6, 2023

@BeauDiddley


I kid you not, I actually spent several minutes trying to understand how you got the one there, asking myself: “how on earth do you get another DataGrid from this analysis?”. Completely oblivious of the MATLAB behaviour...

I think the issue is in my reshape function, I recycled an old one that I had modified. Anyway, happy to hear your are sorted :)

Take care,


David


Reply


Cookie policy

We use cookies to enhance and personalize your experience. If you accept you agree to our full cookie policy. Learn more about our cookies.

 
Cookie settings