
Hello there Zemax community,
In connection to the post
I was wondering if this tool would be the right tool for tracing a sequence of rays in non sequential mode via python.
So far, I have tried using this single ray tracing approach in order to trace a sequence of rays from my source through an optical system which includes two freeform surfaces. This is how my system looks like:
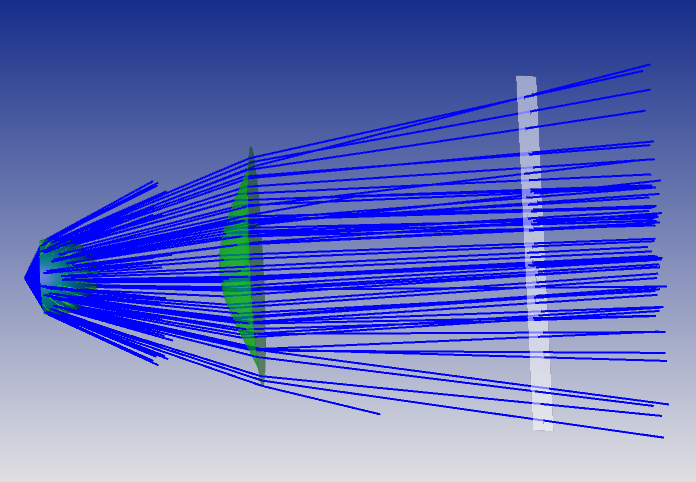
At the end, what I want to do, is to trace specific ray directions originating from the source location (the point at the left) and extract the ray directions after refraction from the first surface towards the second surface.
However, when I try to do this with the single ray tracing tool, for some reason, the tool always traces the same on axis ray and I cannot get any information about the other rays directions.
This is an example of the code that I am using (I am using the python interface to the ZOP-API):
nscsrt = TheSystem.Analyses.New_Analysis(ZOSAPI.Analysis.AnalysisIDM.NSCSingleRayTrace)
nscsrt_settings = nscsrt.GetSettings()
nscsrt_settings.RaySourceX = 0.0
nscsrt_settings.RaySourceY = 0.0
nscsrt_settings.RaySourceZ = 0.0
nscsrt_settings.RefObject = 2

nscsrt_settings.SplitNSCRays = False
nscsrt_settings.ScatterNSCRays = False
nscsrt_settings.UsePolarization = False

for i in range(0,100,1):
     nscsrt_settings.RaySourceL = I_dir[0, i]
     nscsrt_settings.RaySourceM = I_dir[1, i]
     nscsrt_settings.RaySourceN = I_dir[2, i]


     nscsrt.ApplyAndWaitForCompletion()
     nscsrt_data = nscsrt.GetResults().NSCSingleRayTraceData


     data_segment1 = nscsrt_data.ReadSegmentFull(1)
     l_s1.append(data_segment1[10])
     m_s1.append(data_segment1[11])
     n_s1.append(data_segment1[12])

     data_segment2 = nscsrt_data.ReadSegmentFull(2)
     l_s2.append(data_segment2[10])
     m_s2.append(data_segment2[11])
     n_s2.append(data_segment2[12])

     data_segment3 = nscsrt_data.ReadSegmentFull(3)
     l_s3.append(data_segment3[10])
     m_s3.append(data_segment3[11])
     n_s3.append(data_segment3[12])

s1_dirs = np.stack((l_s1,m_s1,n_s1),axis=0)
s2_dirs = np.stack((l_s2,m_s2,n_s2),axis=0)
s3_dirs = np.stack((l_s3,m_s3,n_s3),axis=0)
The array I_dir is just an array containing unit vectors (l,m,n) that represent the specific directions for the rays I am interested in. These ray vectors are simply obtained from a stereographic projection of a half sphere (this means, these ray directions are normal to the surface of the sphere)
Finally, this is plot of the results that I obtain from the single ray tracing analysis:
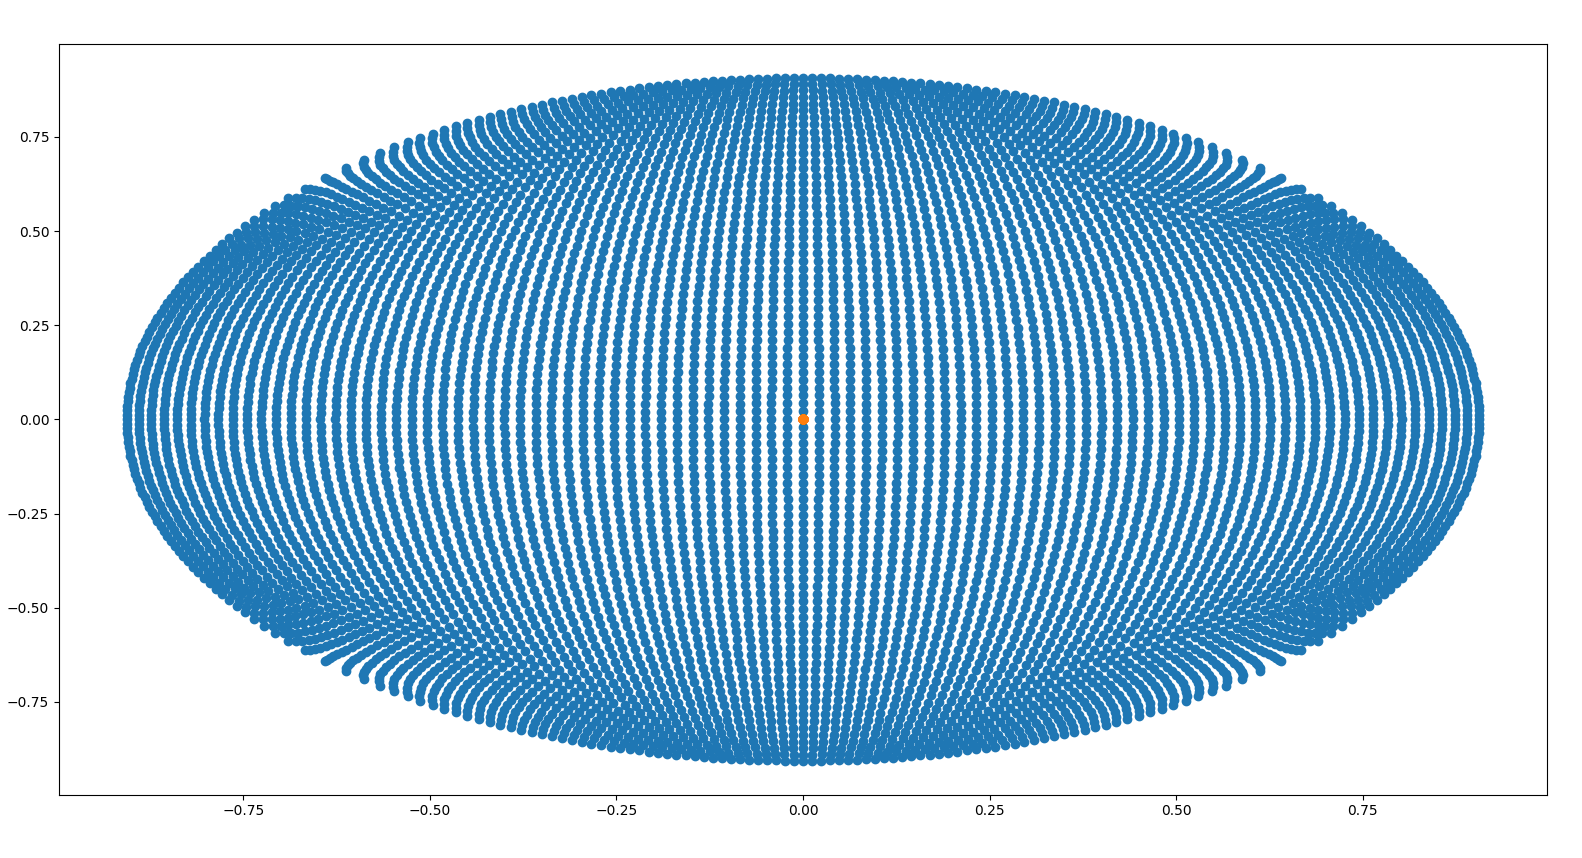
In this case, the blue dots correspond to the x and y components of the unit direction vectors that I am interested in tracing. The orange dot at the center corresponds to the result from the single ray tracing analaysis. As you can see, no matter which ray direction I set, it seems that the analysis is always performed for the on axis ray.
Any idea about what could be happening here? Maybe you have a suggestion on what do do? Could it be possible to trace all of these rays simultaneously and obtain the output ray directions that I need? Is this supported by the API?
In advance, thanks for the help and comments.