Solved

spotdiagram: Exportjpg zplm saves 0 kB images

  • 14 October 2022
  • 4 replies
  • 110 views

Hello everyone out there,

I use a python script and successfully execute some commands:
open a zmx file in the back ground, add/change operands in the merit function, (local) optimization and finally i save the zmx file. When I manually open that file after the python script was run, I can see that everything was executed as intened.

But I fail to use a python script to: load a merit function that simply runs a zplm to export jpg, the exported file are 0 kB “empty”.

Here is the corresponding python script:

TheMFE = TheSystem.MFE
TheSystem = zosapi.TheSystem

## not shown here, but working perfectly fine:
# open zmx file, adding/changing operands in merit function,
# changign values in the lensdata editor, [...]
# running optimization and saving file

# Now I just want to save the focal shift window and spot diagram to jpg

FocalShift = TheSystem.Analyses.New_FocalShiftDiagram()
FocalShift.ApplyAndWaitForCompletion()

Spot = TheSystem.Analyses.New_StandardSpot()
Spot.ApplyAndWaitForCompletion()

mf=r'C:/Test/ExportImage.MF'
TheMFE.LoadMeritFunction(mf)
TheMFE.CalculateMeritFunction()

ExportImage.MF is:
VERS 210726
ZPLM  55   0 0.000000000000E+00 0.000000000000E+00 0.000000000000E+00 0.000000000000E+00 0.000000000000E+00 0.000000000000E+00 0.000000000000E+00 0.000000000000E+00 0.000000000000E+00

and ZPL55.zpl is:
GETSYSTEMDATA 1
EXPORTJPG 1, "C:\Test\Shift"
EXPORTBMP 2, "C:\Test\Spot"
OPTRETURN 0    

Now, the funny thing is: when I manually open the zmx file, manually open the ExportImage.MF, it instantly works as expected: the Shift.jpg and Spot.jpg appear (about 44kB) and are the exact pictures I want.
However, when I load ExportImage.MF via python, the jpgs appear also instantly but are empty.

What am I missing? Has anyone of you encountered that problem as well?
I already tried different winnums, different names, different position in the code. But I have no clue, because the macro workds when I manually load it.

Thanks a lot in advance and best regards
Sarah

icon

Best answer by Sarah.Klein 16 October 2022, 11:51

View original

4 replies

Userlevel 7
Badge +2

Hi Sarah,


I haven’t tried myself but this discussion gives you a sort of answer. In summary, what you are trying to do is not possible at the moment and is listed as a feature request. It should work in Interactive Extension mode though, where OpticStudio is open in parallel (this is because the graphics libraries required to create the images are then active when they wouldn’t be if you open OpticStudio in the background). Alternatively, the workaround seems to be to run these analysis in the ZOS-API and retrieve the data, most likely in the form of a text file that you can parse, to display them yourself.

I hope this helps. Take care,


David

Hello David,

First of all: thanks for that promt reply, it helps a lot - at least I can stop trying

When I landed in that dead end the first time, I already got the focal shift txt and plotted it, I just thought that I was missing something.
However, that spot diagram txt file is quite useless in terms of plotting data it contains :D
But to take the PSF is a nice idea - I already found that thread but failed to run that. 

I receive an error from xLength = matrixData.GetLength(0) that says: 
TypeError: cannot unpack non-iterable NoneType object
 

huygensPSF = TheSystem.Analyses.New_HuygensPsf()    #works fine
huygensPSF.ApplyAndWaitForCompletion() #works fine
huygensResults = huygensPSF.GetResults() #works fine
matrixData = huygensResults.GetDataGrid(0).Values #works fine
xLength = matrixData.GetLength(0) #fails

from: print(dir(matrixData)) I get:
['__add__', '__class__', '__contains__', '__delattr__', '__dir__', '__doc__', '__eq__', '__format__', '__ge__', '__getattribute__', '__getitem__', '__getnewargs__', '__gt__', '__hash__', '__init__', '__init_subclass__', '__iter__', '__le__', '__len__', '__lt__', '__mul__', '__ne__', '__new__', '__reduce__', '__reduce_ex__', '__repr__', '__rmul__', '__setattr__', '__sizeof__', '__str__', '__subclasshook__', 'count', 'index']

So I haven’t pursued that code any further =(
But it seems promising to do now.

Thank you again, best regards and have a nice weekend everyone!
 

Userlevel 7
Badge +2

Hi Sarah,


No problem. I don’t have my OpticStudio laptop to check today, but can you tell us your version of Pythonnet? There have been some issues recently with Pythonnet 3.0.0 and above. I’d recommend sticking to Pythonnet 2.5.2 for now.

Take care, and enjoy the weekend too!


David

Hi David,

Thank you again for the hint to the python version, currently it’s Python 3.8.8.

And here is the code that works for me:
(I copied most of the comments from Allie since they are quite useful)

#Not shown here: opening file [...]

# Open the Huygen's PSF. We will use the default settings for now
huygensPSF = TheSystem.Analyses.New_HuygensPsf()

# Run the analysis with the current settings and pull the results
huygensPSF.ApplyAndWaitForCompletion()
huygensResults = huygensPSF.GetResults()

# The results will be split into multple data structures: Header, Intensity data, Metadata
# We want the intensity data. This is the same data you will see in the Text tab of the analysis
matrixData = huygensResults.GetDataGrid(0).Values

# some informaton about the variable i struggeld with:
# type(matrixData) --> <class 'tuple'>
# print(matrixData) -->
# ((0.00041687, 0.00067239, ...),
# (...),
# ...,
# (...))
# len(matrixData) = 32 and len(matrixData[n])=32 (for n=0...31) psf resolution is 32x32

# here are some useful specs I found via print(dir(huygensResults.GetDataGrid(0)))
xPxl = len(matrixData) # resolution, x pixels --> 32
yPxl = len(matrixData[0]) # resolution, y pixels --> 32
dx = huygensResults.GetDataGrid(0).Dx # x data spacing --> 0.43484984
dy = huygensResults.GetDataGrid(0).Dy # y data spacing --> 0.43484984
minx = huygensResults.GetDataGrid(0).MinX # minimal x value --> -6.9575
miny = huygensResults.GetDataGrid(0).MinY # minimal y value --> -6.9575

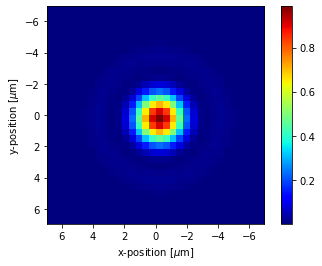
# Plot the data
plt.figure()
plt.imshow(matrixData, cmap='jet', extent=[minx, -minx, miny, -miny]) #I'm not sure if the scale is correct or if you have to add dx
plt.xlabel("x-position ["+r'$\mu$'+"m]")
plt.ylabel("y-position ["+r'$\mu$'+"m]")
plt.colorbar()
plt.show()

And that results in; 

resulting image of plt.imshow()


Best regards
Sarah

Reply