Hi Elisavet,
Are you changing the Index type to GRIN before applying your code? It may be that you are receiving a NoneType error because the GRIN index type is not active. I have run a test in Interactive mode with the following code, and it worked:
TheNCE = TheSystem.NCE
object1 = TheNCE.GetObjectAt(1)
indexData = object1.IndexData
indexData.IndexType = ZOSAPI.Editors.NCE.NCEIndexType.GRIN
modelSettings = indexData.ModelSettings
grinSettings = modelSettings._S_GRIN
grinSettings.DLL = 'grin2.DLL'
It is broken up a bit more than your code, but shows the steps I would take to make these changes. I have split each new object into its own variable for clarity, but you can re-combine them into a single line if you prefer.
Let me know if this doesn't work for you.
Best,
Allie
It worked. Thank you.
pm. Could you also tell me how to set up the pick up a parameter from another object option via the API? Is that possible?
Hi Elisavet,
I'm glad that worked for you!
We can definitely set pickups via the API. This is done using the IEditorCell interface. We have a few example of this in the sample code we provide. Here's an excerpt from sample #7 - Tilt and Decenter Elements:
# ! [e07s05_py]
# set pickup solves for coordinate break tilt/decenter parameter cells
# these parameters are columns 12-16 in the Lens Data Editor (parameters 1-5)
surf3 = TheSystem.LDE.GetSurfaceAt(3)
surf6 = TheSystem.LDE.GetSurfaceAt(6)
ParameterPickup = surf6.GetCellAt(12).CreateSolveType(ZOSAPI.Editors.SolveType.SurfacePickup)
ParameterPickup._S_SurfacePickup.Surface = 3
ParameterPickup._S_SurfacePickup.ScaleFactor = -1
ParameterPickup._S_SurfacePickup.MakePickupFromCurrentColumn()
for i in range(12, 17):
surf6.GetCellAt(i).SetSolveData(ParameterPickup)
surf3.GetCellAt(i).DoubleValue = np.random.uniform(-0.1, .01) # assign random tilt/decenter values
The example is in Sequential Mode, but the structure is very similar for Non-Sequential Mode. This is because IEditorCell is mode-agnostic. So, you will need to identify the cell you want to apply the pickup to, and then follow the code above to do so!
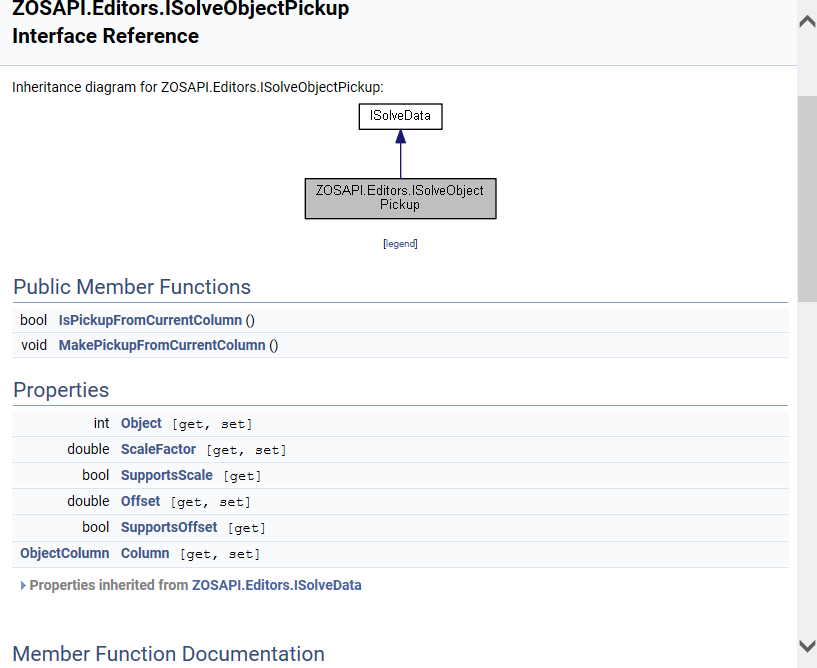
Edit: Actually, the solve you will set has a slightly different name in NSC Mode: ObjectPickup. Here are its properties:
Let me know if you have any other questions about this .
All the best,
Allie
Ok, for the NCE editor, it was slightly different, but I managed to set it up. Another API related question. Is it possible to read values from a detector rectangle via the API? For example the peak incoherent irradiance in non-sequential mode?
Edit: I've just found an example that you can get the data out and plot them in Python. But it's not very clear to me, as the syntax used is different to the one I am using. I use standalone mode, and some boilerplate code provided for that, namely I access things through an instance of the PythonStandaloneApplication() class and the variables it provides. Ideally, I would like to get the data of the cross-section column and plot them.
Hi Elisavet,
Thanks for your follow-up question here!
Happy to hear that you managed to set up the pickups in NSC mode.
Regarding your other question about how to pull the detector data, my colleague Allie wrote some useful forum posts about this. Please find below the direct links, MATLAB code is also provided with these examples:
Methods for extracting detector data through the API · MyZemax
How can I pull Peak Irradiance or Total Hits from the Detector Viewer analysis in the API? · MyZemax
How do I output the image of an analysis in ZOS-API? · MyZemax
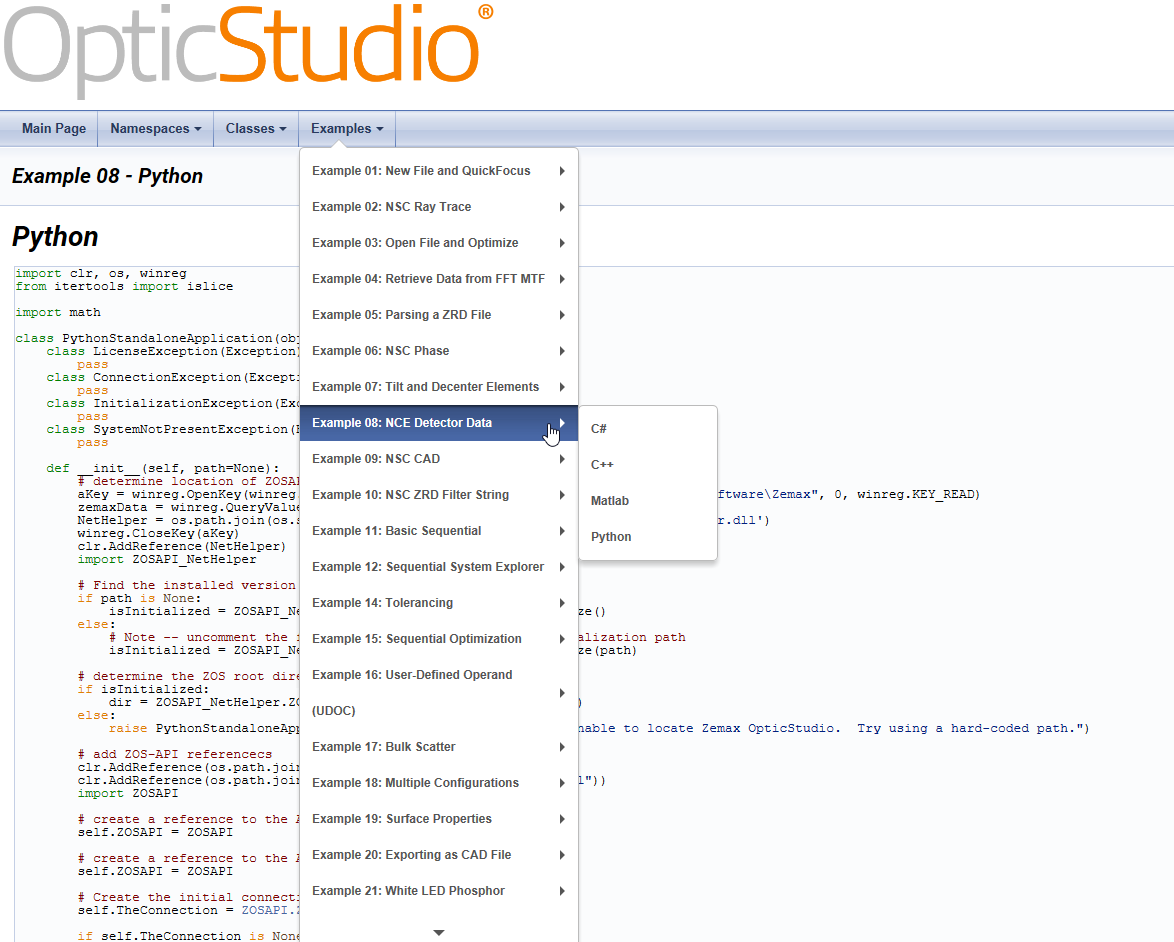
Besides, we also have an example #8 - NCE Detector Data in the ZOS-API Syntax Help, which shows how to pull the detector data from the API. Here you can also check the syntax in python:
I hope this helps, but if you have any further questions, please let us know and we will be happy to help!
Best,
Csilla
I am currently using an older version, OpticStudio 19.4 SP2 and this example (Example 8) is not included. Can I still manage to set it up or do I have first to upgrade to the current version?
Edit 1: I tried the TheSystem.NCE.GetAllDetectorDataSafe(4,0) approach, but I get a value error thrown by the flipud numpy function: 'ValueError: Input must be >= 1-d'.
What could have gone wrong? I have defined two detectors rectangle in NSC mode and used the snippet of code from the first link you suggested, which is fairly simple:
detector_output = TheSystem.NCE.GetAllDetectorDataSafe(4,0)
detector_input = TheSystem.NCE.GetAllDetectorDataSafe(5,0)
data_output = np.flipud(detector_output)
data_input = np.flipud(detector_input)
I solved this issue, but there are problems with the values retrieved, see the following two posts
Edit 2: With the first approach suggested in the first link, namely by calling the DetectorViewer, no errors are thrown, but the image is not created. But anyway, I'd prefer to pull out the data and plot them in Python.
Edit 3: I have tried to get the results out with GetResults() and since I am using standalone mode, there are two function to do that, I chose DoubleToNumpy. I don't have access to a working example as I first mentioned, so I am really trying things out in blind based on the matlab examples provided in the links. But I'd appreciate some feedback. So, I've used the following:
detector = TheSystem.Analyses.New_Analysis(ZOSAPI.Analysis.AnalysisIDM.DetectorViewer)
detSettings = detector.GetSettings()
detSettings.Detector.SetDetectorNumber(4)
detSettings.ShowAs = ZOSAPI.Analysis.DetectorViewerShowAsTypes.Text_CrossSection_Column
detSettings.DataType = ZOSAPI.Analysis.DetectorViewerShowDataTypes.IncoherentIrradiance
detSettings.Scale = ZOSAPI.Analysis.Settings.DetectorViewerScaleTypes.Linear
detSettings.Smoothing = 10
detSettings.OutFile = 'Detector_4_Image.JPG';
detector.ApplyAndWaitForCompletion();
detResults = detector.GetResults()
data = zosapi.DoubleToNumpy(detResults.DataGrids)
Ok, no JPG is created as I mentioned in my second edit. But what I want is to pull out the text data, store them in a numpy array and plot them in Python. I get an exception 'ArgumentException: Object contains non-primitive or non-blittable data.'
The HeaderData and DataGrids must contain more than number I am guessing. How could I do this in Python?
This refers to edit 1 in the above post. I've turned the detector output to some valid array with the DoubleToNumpy() function, but the results are non-sensical. Even though the output data are 500x500, this can't be the color plot I see in the detector viewer, it seems as only one column is retrieved when you plot it. In addition, the range is all wrong. I defined the detectors in the NSC editor as I want to plot them, incoherent data, false color etc, but this doesn't work. The incoherent data should is in the 10^3 range and the results I get from the below snippet are in the 10^-3. Plus the numbers themselves are all wrong. Can you help me out? I'd also appreciate some feedback on the other approach Edit 3, in the post above.
detector_output = TheSystem.NCE.GetAllDetectorDataSafe(4, 0)
detector_input = TheSystem.NCE.GetAllDetectorDataSafe(final_no_objects, 0)
data_output = zosapi.DoubleToNumpy(detector_output)
data_input = zosapi.DoubleToNumpy(detector_input)
plt.figure()
plt.imshow(data_output.reshape(500,500))
plt.title('Output')
plt.figure()
plt.imshow(data_input.reshape(500,500))
plt.title('Input')
Even though I don't get why (in the help it says the arguments are ObjectNumber and Data, so from that I got that the second argument should be the data type-anyway the ZOS-API help is not that well documented), I think according to the second link attached, I have set the settings 'Data type' of the Detector Rectangle to 0 in order to retrieve the Incoherent Irradiance, but the second argument in GetAllDetectorDataSafe() needs to be 1 instead of 0 and still get non-sensical results:
TheSystem.NCE.GetAllDetectorDataSafe(4, 1)
TheSystem.NCE.GetAllDetectorDataSafe(final_no_objects, 1)
input = 226.6741496770889 -> this is the max value of detector 4
output = 180.51467170130167 -> this is the max value of detector final_no_objects
When I open the zemax file and read the plots from the detector viewer the peak values are 62 and 50.9, respectively. There is a similar issue when I do this with the NSDD command and a ZPL macro. I assume this discrepancy exists for the same reason. Is there a difference in calculation between the detector viewer and the NSDD command, or this ZOS-API functionality?
Edit: I found out that this discrepancy stems from smoothing the data. Even though I have set the same smoothing in the detector viewer and the respective field in the NSC editor for the Detector Rectangle, when I calculate it with the NSDD command, the results are those without any smoothing. This is such a strange behavior. Have I missed a step? I assume this is the case for the ZOS-API functionality as well.