I followed the sample script and extract the mtf data using
xRaw = data.XData.Data
yRaw = data.YData.Data
and what I realized is that the MTF is not given in integer location. instead of report the MTF at 50lp/mm it’s reporting MTF at 49.9136879lp/mm.
is there any way to get the MTF right at the rounded location?
Thanks,
Yu
Best answer by YuY
Hi @YuY ,
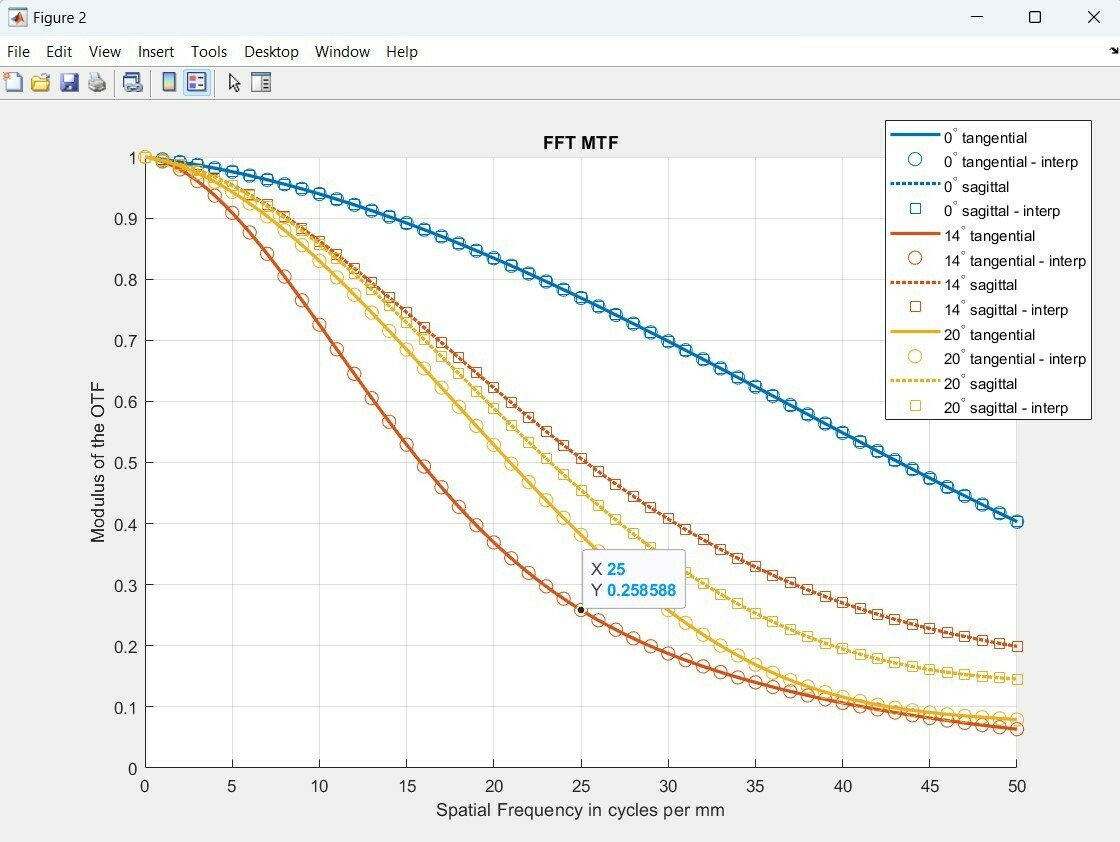
API returns 300 data points per field. Therefore depending on the maximum frequency, the data point steps for XData (i.e., spatial frequency) varies. If you need MTF values at specific spatial frequencies you can perform a 1D interpolation . Below is the modified MATLAB code for Example 04: Retrieve Data from FFT MTF where a spline fit is used for obtaining MTF values at integer locations.
% Read and plot data series dataSeries = newWin_Results.DataSeries; cc=lines(double(newWin_Results.NumberOfDataSeries)); for gridN=1:newWin_Results.NumberOfDataSeries data = dataSeries(gridN); y = data.YData.Data.double; x = data.XData.Data.double;
plot(x,y(:,1),'-','color',cc(gridN,:),'linewidth',2); plot(x_interp,y_interp(:,1),'o','color',cc(gridN,:),'Markersize',8); plot(x,y(:,2),':','color',cc(gridN,:),'linewidth',2); plot(x_interp,y_interp(:,2),'s','color',cc(gridN,:),'Markersize',8); end
The below screenshot shows the MTF results from the available DataSeries along with the interpolated data.
Hi Elham,
Thanks for your response. that’s a great idea to interpolate!
what I actually did is set the max frequency to 149(150 -1 to compensate the starting point). as you mentioned, API returns 300 data point. by setting max frequency to 150, I can get the step size of 0.5, since frequency of interest is below 150lp/mm, so max frequency works perfect for me.
API returns 300 data points per field. Therefore depending on the maximum frequency, the data point steps for XData (i.e., spatial frequency) varies. If you need MTF values at specific spatial frequencies you can perform a 1D interpolation . Below is the modified MATLAB code for Example 04: Retrieve Data from FFT MTF where a spline fit is used for obtaining MTF values at integer locations.
% Read and plot data series dataSeries = newWin_Results.DataSeries; cc=lines(double(newWin_Results.NumberOfDataSeries)); for gridN=1:newWin_Results.NumberOfDataSeries data = dataSeries(gridN); y = data.YData.Data.double; x = data.XData.Data.double;
plot(x,y(:,1),'-','color',cc(gridN,:),'linewidth',2); plot(x_interp,y_interp(:,1),'o','color',cc(gridN,:),'Markersize',8); plot(x,y(:,2),':','color',cc(gridN,:),'linewidth',2); plot(x_interp,y_interp(:,2),'s','color',cc(gridN,:),'Markersize',8); end
The below screenshot shows the MTF results from the available DataSeries along with the interpolated data.
If you just have 1 frequency you care about, you can simply set the Maximum Frequency to that value and OpticStudio will always exactly show this value as the last data point.
Also, you can use the MTFS/MTFT with Grid = 1 or MTHS/MTHT Merit Function Operands.
API returns 300 data points per field. Therefore depending on the maximum frequency, the data point steps for XData (i.e., spatial frequency) varies. If you need MTF values at specific spatial frequencies you can perform a 1D interpolation . Below is the modified MATLAB code for Example 04: Retrieve Data from FFT MTF where a spline fit is used for obtaining MTF values at integer locations.
% Read and plot data series dataSeries = newWin_Results.DataSeries; cc=lines(double(newWin_Results.NumberOfDataSeries)); for gridN=1:newWin_Results.NumberOfDataSeries data = dataSeries(gridN); y = data.YData.Data.double; x = data.XData.Data.double;
plot(x,y(:,1),'-','color',cc(gridN,:),'linewidth',2); plot(x_interp,y_interp(:,1),'o','color',cc(gridN,:),'Markersize',8); plot(x,y(:,2),':','color',cc(gridN,:),'linewidth',2); plot(x_interp,y_interp(:,2),'s','color',cc(gridN,:),'Markersize',8); end
The below screenshot shows the MTF results from the available DataSeries along with the interpolated data.
Hi Elham,
Thanks for your response. that’s a great idea to interpolate!
what I actually did is set the max frequency to 149(150 -1 to compensate the starting point). as you mentioned, API returns 300 data point. by setting max frequency to 150, I can get the step size of 0.5, since frequency of interest is below 150lp/mm, so max frequency works perfect for me.