Hi Shimpei,
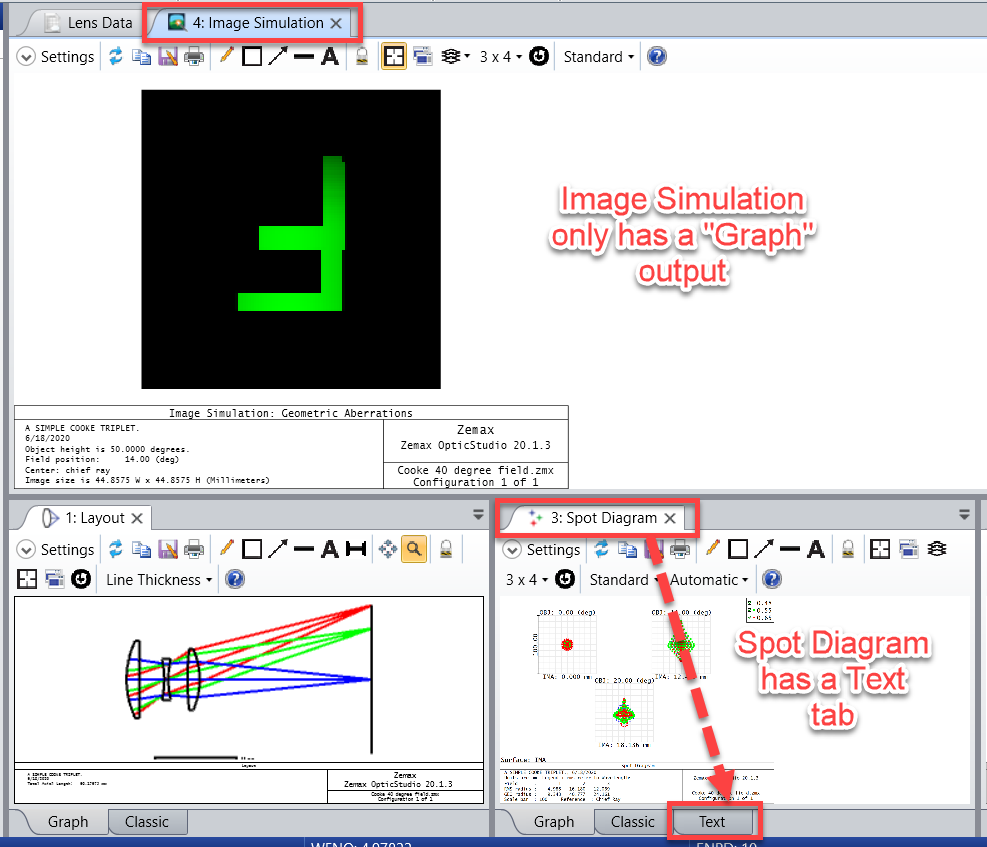
Typically, a Data Grid represents a matrix of data as given by the Text tab of an analysis. When we open Image Simulation, we see that there is no text tab available:

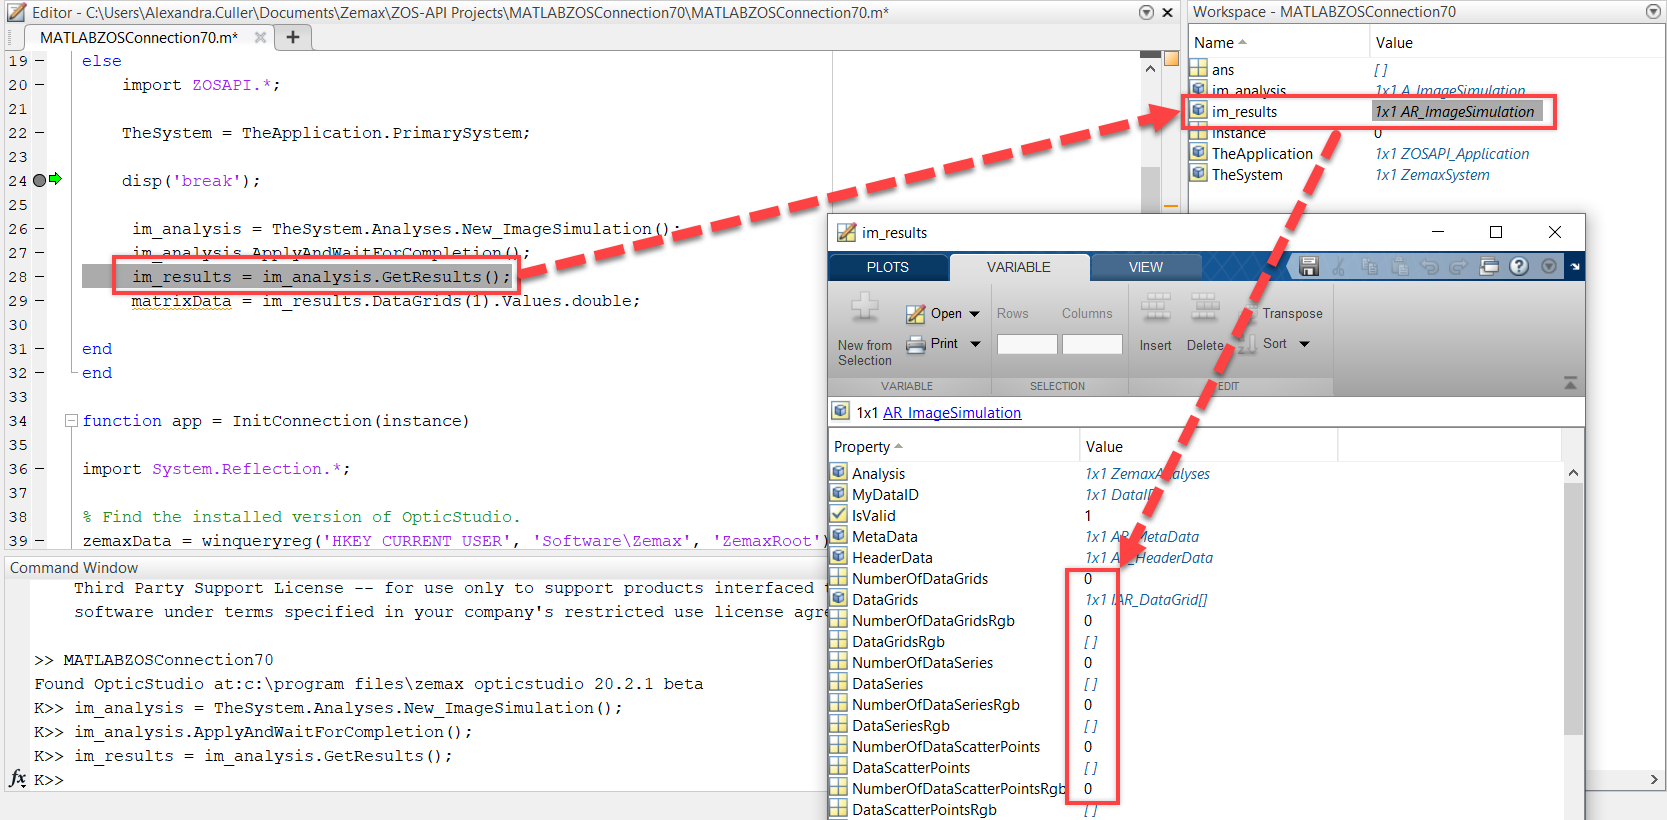
This is an initial indication that the Image Simulation analysis tool in the API may not have a Data Grid available. We can confirm this by inspecting the object im_results in Matlab. When we inspect it, we are able to see how many Data Grids or Data Series are available to us. In the image below, we see that the object im_results has no available entities in the GetResults() interface:

(Note: for more information on identifying which analysis types are available for your analysis, see the Knowledgebase article 'Generating a list of output data types for each analysis in the ZOS-API').
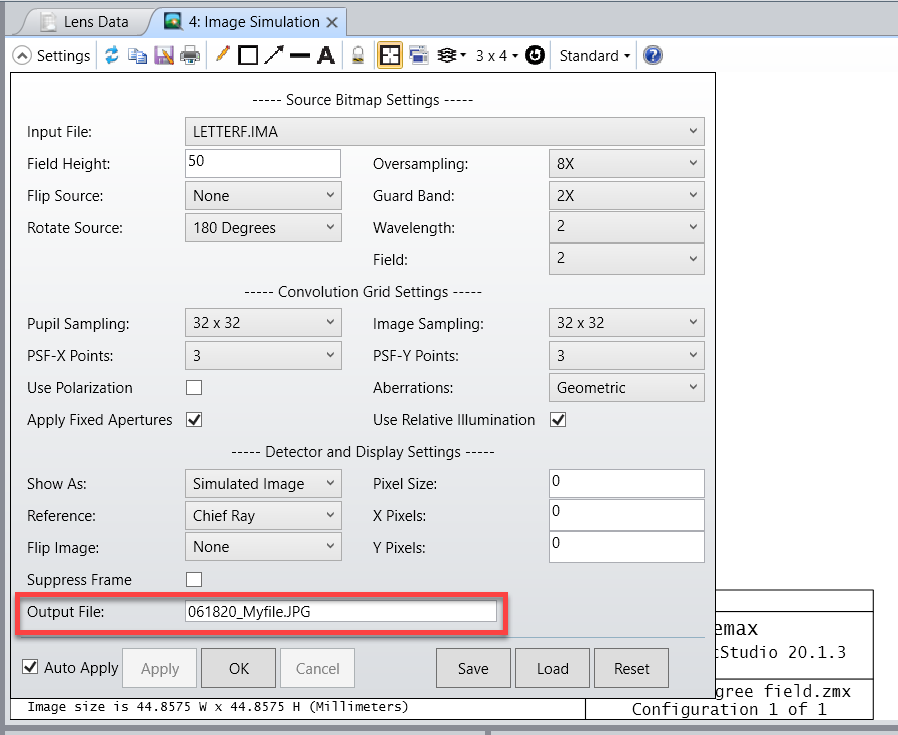
Image Simulation is unique in that it has no numeric output, so even the property GetTextFile will not work in this case. Rather, the Image Simulation tool allows us to save the output through the settings:

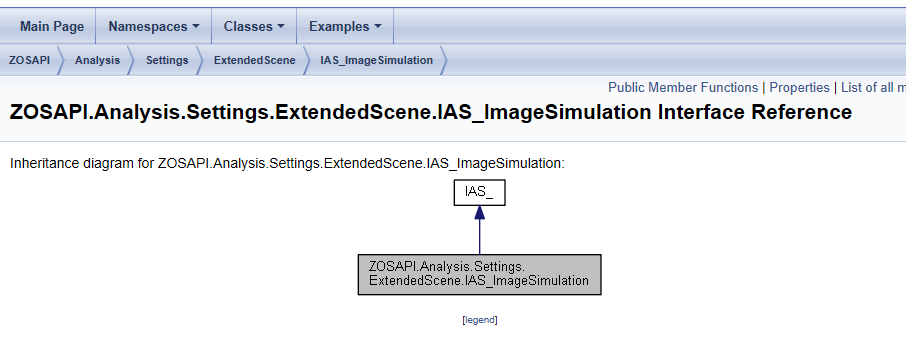
This means we need to use the Image Simulation settings interface instead of the results interface. All of the available settings are available in the ZOS-API Syntax Help file here:

In that interface, we will find a property OutputFile which may be implemented in the following way:
im_analysis = TheSystem.Analyses.New_ImageSimulation();
im_settings = im_analysis.GetSettings();
im_settings.OutputFile = '061820_Myfile.JPG';
im_analysis.ApplyAndWaitForCompletion();
Any settings you wish to update need to be declared before the ApplyAndWaitForCompletion line. With the code above, I am updating the settings so that the Image Simulation result will be saved to the file '061820_Myfile.JPG'. This will save to the {Zemax}\IMAFiles folder.
Let me know if you have any other questions about this!
Best,
Allie


