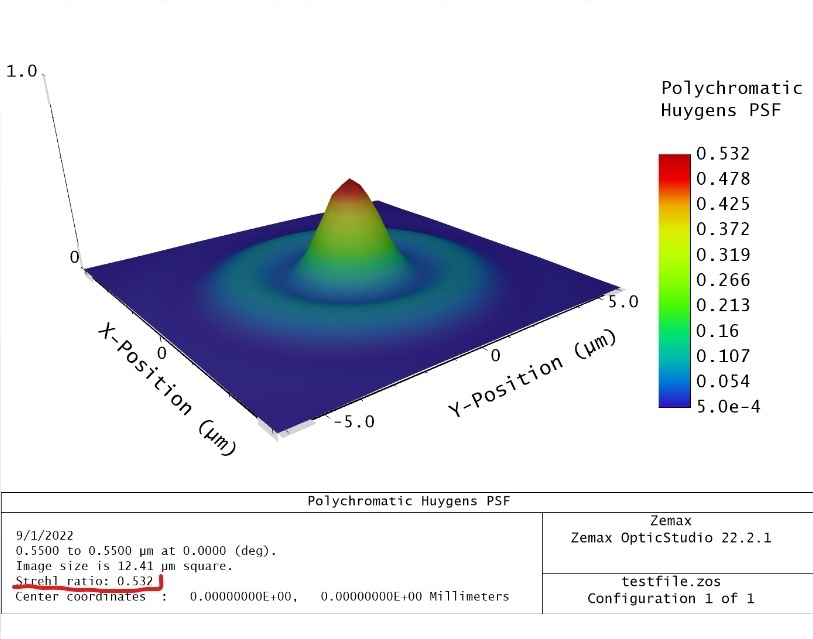
I’m working on a code to see how the Strehl ratio of our system changes over different iterations. I’m trying to extract the Strehl Ratio from the Huygens PSF like in the image below
However, I can’t seem to find how I can do this. Can anyone help?
Best answer by MichaelH
Hi Alex,
If you’ve noticed, the Strehl Ratio is simply the maximum Z value when you have the Normalize box unchecked. So while you cannot access the HeaderData from the Huygens PSF analysis (Zemax never hooked up this code block), you can simply get the non-normalized data & find the maximum value:
# open and run Huygens PSF win = zos.TheSystem.Analyses.New_Analysis(zos.ZOSAPI.Analysis.AnalysisIDM.HuygensPsf) ws = win.GetSettings(); ws.Normalize = False; win.ApplyAndWaitForCompletion()
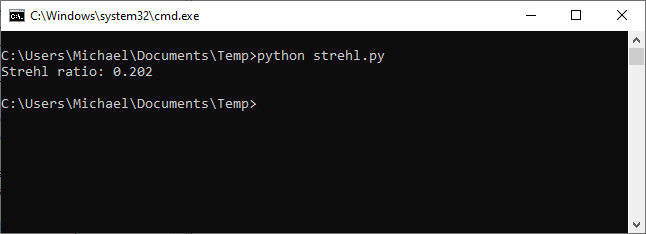
# get the strehl ratio frm the raw data wr = win.GetResults(); data = wr.DataGrids[0].Values; strehl = max(list(data)) print('Strehl ratio: %4.3f' % strehl)
If you’ve noticed, the Strehl Ratio is simply the maximum Z value when you have the Normalize box unchecked. So while you cannot access the HeaderData from the Huygens PSF analysis (Zemax never hooked up this code block), you can simply get the non-normalized data & find the maximum value:
# open and run Huygens PSF win = zos.TheSystem.Analyses.New_Analysis(zos.ZOSAPI.Analysis.AnalysisIDM.HuygensPsf) ws = win.GetSettings(); ws.Normalize = False; win.ApplyAndWaitForCompletion()
# get the strehl ratio frm the raw data wr = win.GetResults(); data = wr.DataGrids[0].Values; strehl = max(list(data)) print('Strehl ratio: %4.3f' % strehl)