Hello all,
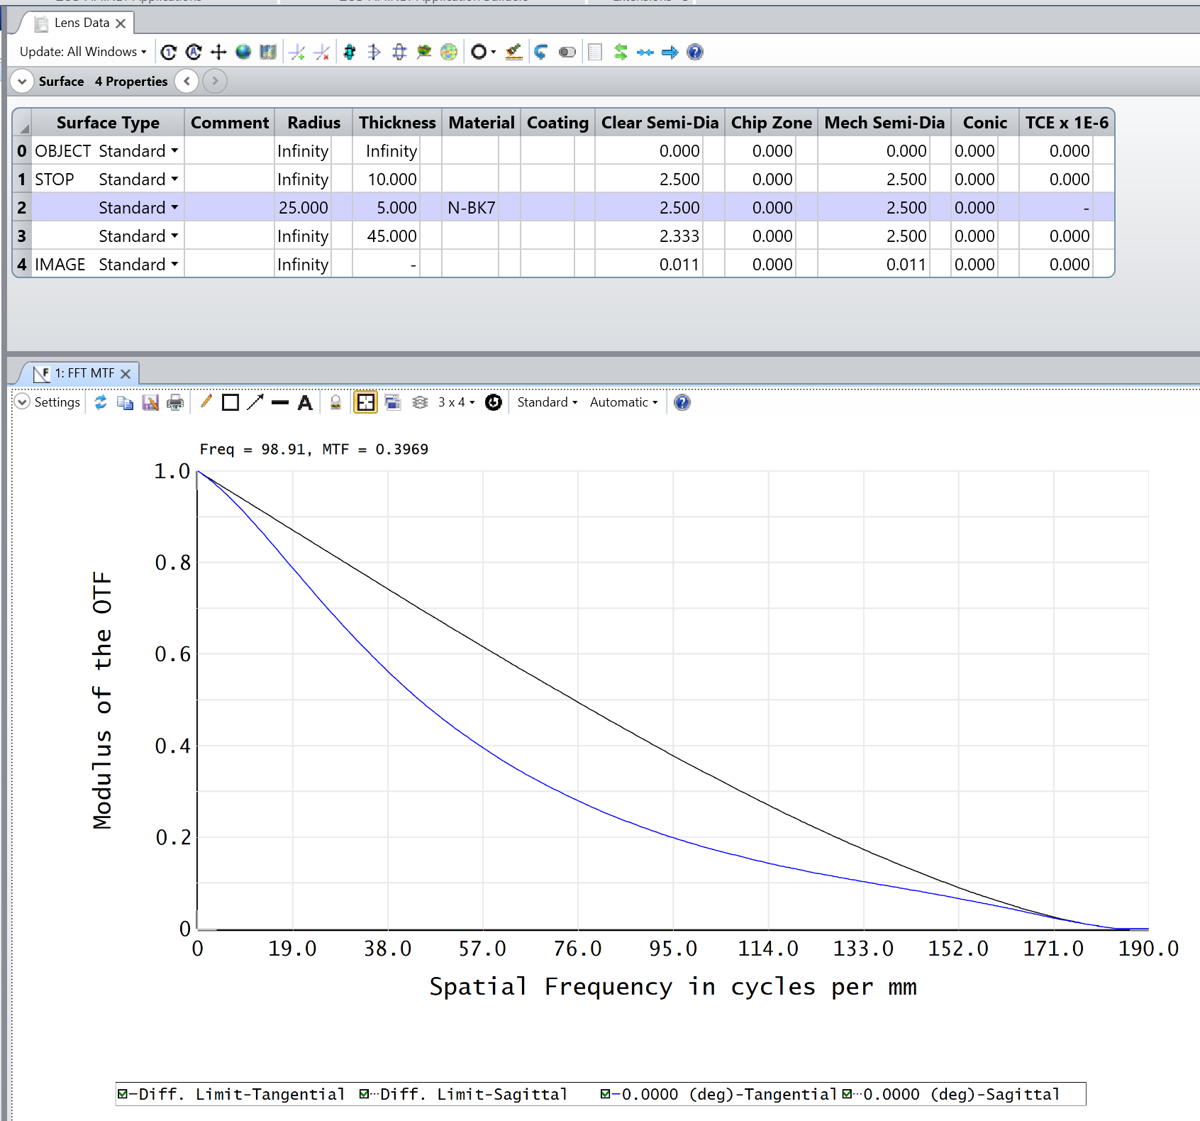
How to extract the diffraction limited spatial frequency values in tangential/sagittal planes for FFT-MTF?
I am unable to find a reference to this in the ZOS-API interface documentation. Additionally, how to do the same in a ZPL?
Cheers
Hello all,
How to extract the diffraction limited spatial frequency values in tangential/sagittal planes for FFT-MTF?
I am unable to find a reference to this in the ZOS-API interface documentation. Additionally, how to do the same in a ZPL?
Cheers
Best answer by David.Nguyen
Hi Asuku,
The diffraction limited data will be stored as the first DataSerie in the result interface.
Here is a simple example that demonstrates how to plot FFT MTF data (this is inspired from Example 23 in the Syntax Help File), this file is also attached to my reply:

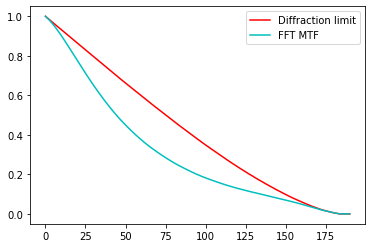
Here is the Python code to reproduce a similar plot (only with the tangential component) in an Interactive Extension:
import numpy as np
import matplotlib.pyplot as plt


# Open FFT MTF
my_fft_mtf = TheSystem.Analyses.New_FftMtf()

# Get FFT MTF settings
fft_mtf_settings = my_fft_mtf.GetSettings()

# Show diffraction limit
fft_mtf_settings.ShowDiffractionLimit = True

# Run FFT MTF
my_fft_mtf.ApplyAndWaitForCompletion()

# Get FFT MTF results
fft_mtf_results = my_fft_mtf.GetResults()

# Check how many data series are available
print('Number of data series = ' + str(fft_mtf_results.NumberOfDataSeries))

# First data serie: diffraction limit
data_1 = fft_mtf_results.GetDataSeries(0)

x_1 = np.asarray(tuple(data_1.XData.Data))
y_1 = np.asarray(tuple(data_1.YData.Data))
# Side note: this splits between tangential and sagittal data series
y_1 = y_1.reshape(data_1.YData.Data.GetLength(0), data_1.YData.Data.GetLength(1))

# Second data serie: actual FFT MTF
data_2 = fft_mtf_results.GetDataSeries(1)

y_2 = np.asarray(tuple(data_2.YData.Data))
y_2 = y_2.reshape(data_2.YData.Data.GetLength(0), data_2.YData.Data.GetLength(1))

# Plot data series (only tangential)
plt.figure()
plt.plot(x_1, y_1[:, 0], 'r', label='Diffraction limit')
plt.plot(x_1, y_2[:, 0], 'c', label='FFT MTF')
plt.legend()
plt.show()

# Close FFT MTF
my_fft_mtf.Close()
This is what it plots:

I did not double-check that I was indeed plotting the tangential and not sagittal data so better double-check, but I think you get the idea.
Take care,
David
Enter your E-mail address. We'll send you an e-mail with instructions to reset your password.