Hello all,
How to extract the diffraction limited spatial frequency values in tangential/sagittal planes for FFT-MTF?
I am unable to find a reference to this in the ZOS-API interface documentation. Additionally, how to do the same in a ZPL?
Cheers

Hello all,
How to extract the diffraction limited spatial frequency values in tangential/sagittal planes for FFT-MTF?
I am unable to find a reference to this in the ZOS-API interface documentation. Additionally, how to do the same in a ZPL?
Cheers
Best answer by David.Nguyen
Hi Asuku,
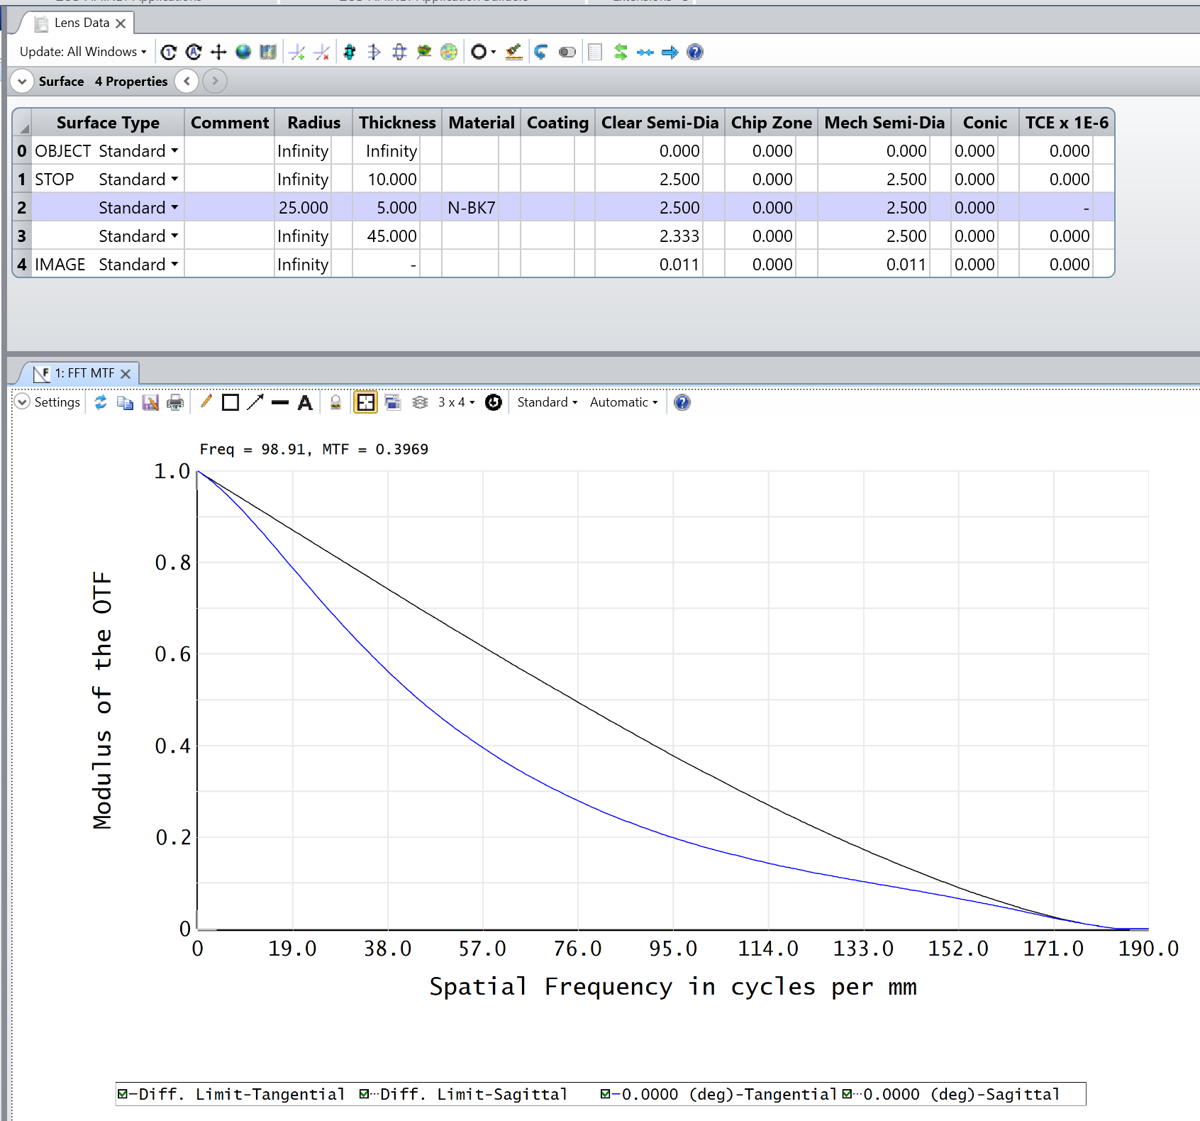
The diffraction limited data will be stored as the first DataSerie in the result interface.
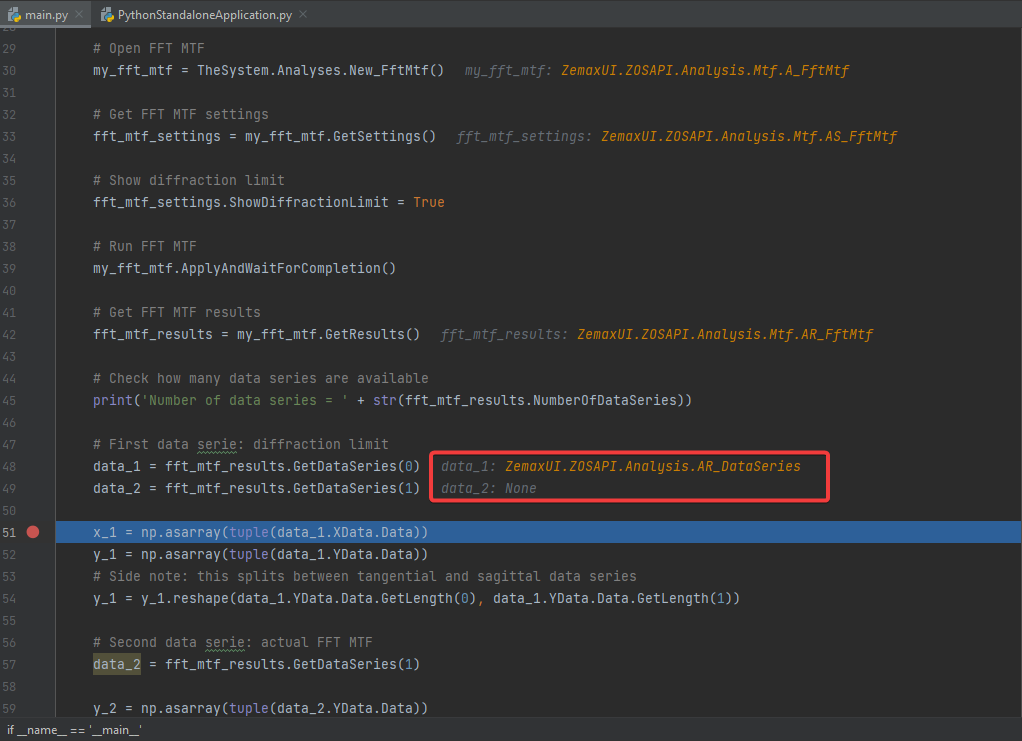
Here is a simple example that demonstrates how to plot FFT MTF data (this is inspired from Example 23 in the Syntax Help File), this file is also attached to my reply:
Here is the Python code to reproduce a similar plot (only with the tangential component) in an Interactive Extension:
import numpy as np
import matplotlib.pyplot as plt
# Open FFT MTF
my_fft_mtf = TheSystem.Analyses.New_FftMtf()
# Get FFT MTF settings
fft_mtf_settings = my_fft_mtf.GetSettings()
# Show diffraction limit
fft_mtf_settings.ShowDiffractionLimit = True
# Run FFT MTF
my_fft_mtf.ApplyAndWaitForCompletion()
# Get FFT MTF results
fft_mtf_results = my_fft_mtf.GetResults()
# Check how many data series are available
print('Number of data series = ' + str(fft_mtf_results.NumberOfDataSeries))
# First data serie: diffraction limit
data_1 = fft_mtf_results.GetDataSeries(0)
x_1 = np.asarray(tuple(data_1.XData.Data))
y_1 = np.asarray(tuple(data_1.YData.Data))
# Side note: this splits between tangential and sagittal data series
y_1 = y_1.reshape(data_1.YData.Data.GetLength(0), data_1.YData.Data.GetLength(1))
# Second data serie: actual FFT MTF
data_2 = fft_mtf_results.GetDataSeries(1)
y_2 = np.asarray(tuple(data_2.YData.Data))
y_2 = y_2.reshape(data_2.YData.Data.GetLength(0), data_2.YData.Data.GetLength(1))
# Plot data series (only tangential)
plt.figure()
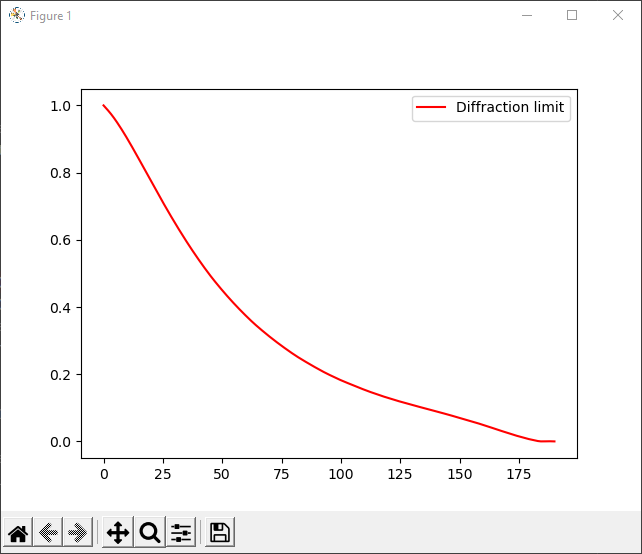
plt.plot(x_1, y_1[:, 0], 'r', label='Diffraction limit')
plt.plot(x_1, y_2[:, 0], 'c', label='FFT MTF')
plt.legend()
plt.show()
# Close FFT MTF
my_fft_mtf.Close()This is what it plots:
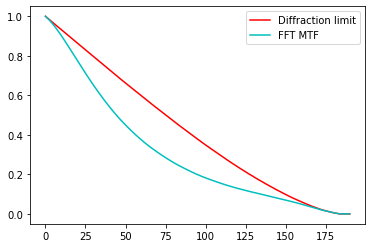
I did not double-check that I was indeed plotting the tangential and not sagittal data so better double-check, but I think you get the idea.
Take care,
David
Enter your E-mail address. We'll send you an e-mail with instructions to reset your password.
Do not provide any information or data that is restricted by applicable law, including by the People’s Republic of China’s Cybersecurity and Data Security Laws ( e.g., Important Data, National Core Data, etc.).
不要提供任何受适用法律,包括中华人民共和国的网络安全和数据安全法限制的信息或数据(如重要数据、国家核心数据等)。