Hello community,  

I hope somebody is familiar with this topic and has a quick hint. I would like to use the transmission plots (especially TransmissionFan) of Zemax by controlling them in Python. Yet, I miss the possibility to change the settings. My Code looks as follows:


{… I hope the stuff before is clear ...}    

TheAnalyses = TheSystem.Analyses
Window= TheAnalyses.New_Analysis(ZOSAPI.Analysis.AnalysisIDM.TransmissionFan)
Settings= Window.GetSettings()
dir(Settings)

The output looks as follows:

p'AddChild',
 'Analysis',
 'CreateObjRef',
 'Disconnect',
 'Equals',
 'Finalize',
 'GetHashCode',
 'GetLifetimeService',
 'GetType',
 'InitializeLifetimeService',
 'IsActiveWindow',
 'IsValid',
 'Load',
 'LoadFrom',
 'MemberwiseClone',
 'ModifySettings',
 'OS',
 'Overloads',
 'Parent',
 'ReferenceEquals',
 'RemoveChild',
 'Reset',
 'Save',
 'SaveTo',
 'TheDataID',
 'ToString',
 'Update',
 'UpdateCore',
 'UpdateUI',
 'Verify',
 'WriteToStream',
 '__call__',
 '__class__',
 '__delattr__',
 '__delitem__',
 '__dir__',
 '__doc__',
 '__eq__',
 '__format__',
 '__ge__',
 '__getattribute__',
 '__getitem__',
 '__gt__',
 '__hash__',
 '__init__',
 '__init_subclass__',
 '__iter__',
 '__le__',
 '__lt__',
 '__module__',
 '__ne__',
 '__new__',
 '__overloads__',
 '__reduce__',
 '__reduce_ex__',
 '__repr__',
 '__setattr__',
 '__setitem__',
 '__sizeof__',
 '__str__',
 '__subclasshook__',
 'get_Analysis',
 'get_IsActiveWindow',
 'get_IsValid',
 'get_Parent',
 'get_TheDataID',
 'set_IsValid']

Hence, I am missing the possibility to change any setting as for example wavelength or field point. The same can be seen when other Transmission-IDMs are used as for example “ZOSAPI.Analysis.AnalysisIDM.TransmissionvsAngle” or “ZOSAPI.Analysis.AnalysisIDM.Transmission” or similar. Is there a different way to control the settings?

Usually, this “Settings”-function can be modified as follows (for example for “ZOSAPI.Analysis.AnalysisIDM.FieldCurvatureAndDistortion”): 

Settings.ScanType=0
Settings.IgnoreVignette=0
Settings.Wavelength.SetWavelengthNumber(0)
Settings.Distortion=0


I am wondering if these functions are missing or if there is a different way to control them?


Thank you for any help!


Gregor


Dear Gregor,


My short answer would be that these are not implemented yet, and my long answer below explains how to check whether the settings are implemented or not.

In the analysis interface there’s a read-only boolean property called HasAnalysisSpecificSettings. This property returns True if the settings have been fully implemented in the ZOS-API. Last time I checked, this property was False for the TransmissionFan, but I would advised to check again on your end. Based on the code you shared, you want to try the following line:

print(Window.HasAnalysisSpecificSettings)

If it is indeed False. You need to modify the settings of this analysis window differently. If you open the ZOS-API Syntax Help under the Analysis Settings interface (IAS_), you will notice three boolean methods (in fact, those are apparent in the output you shared above):

  1. SaveTo
  2. LoadFrom
  3. ModifySettings

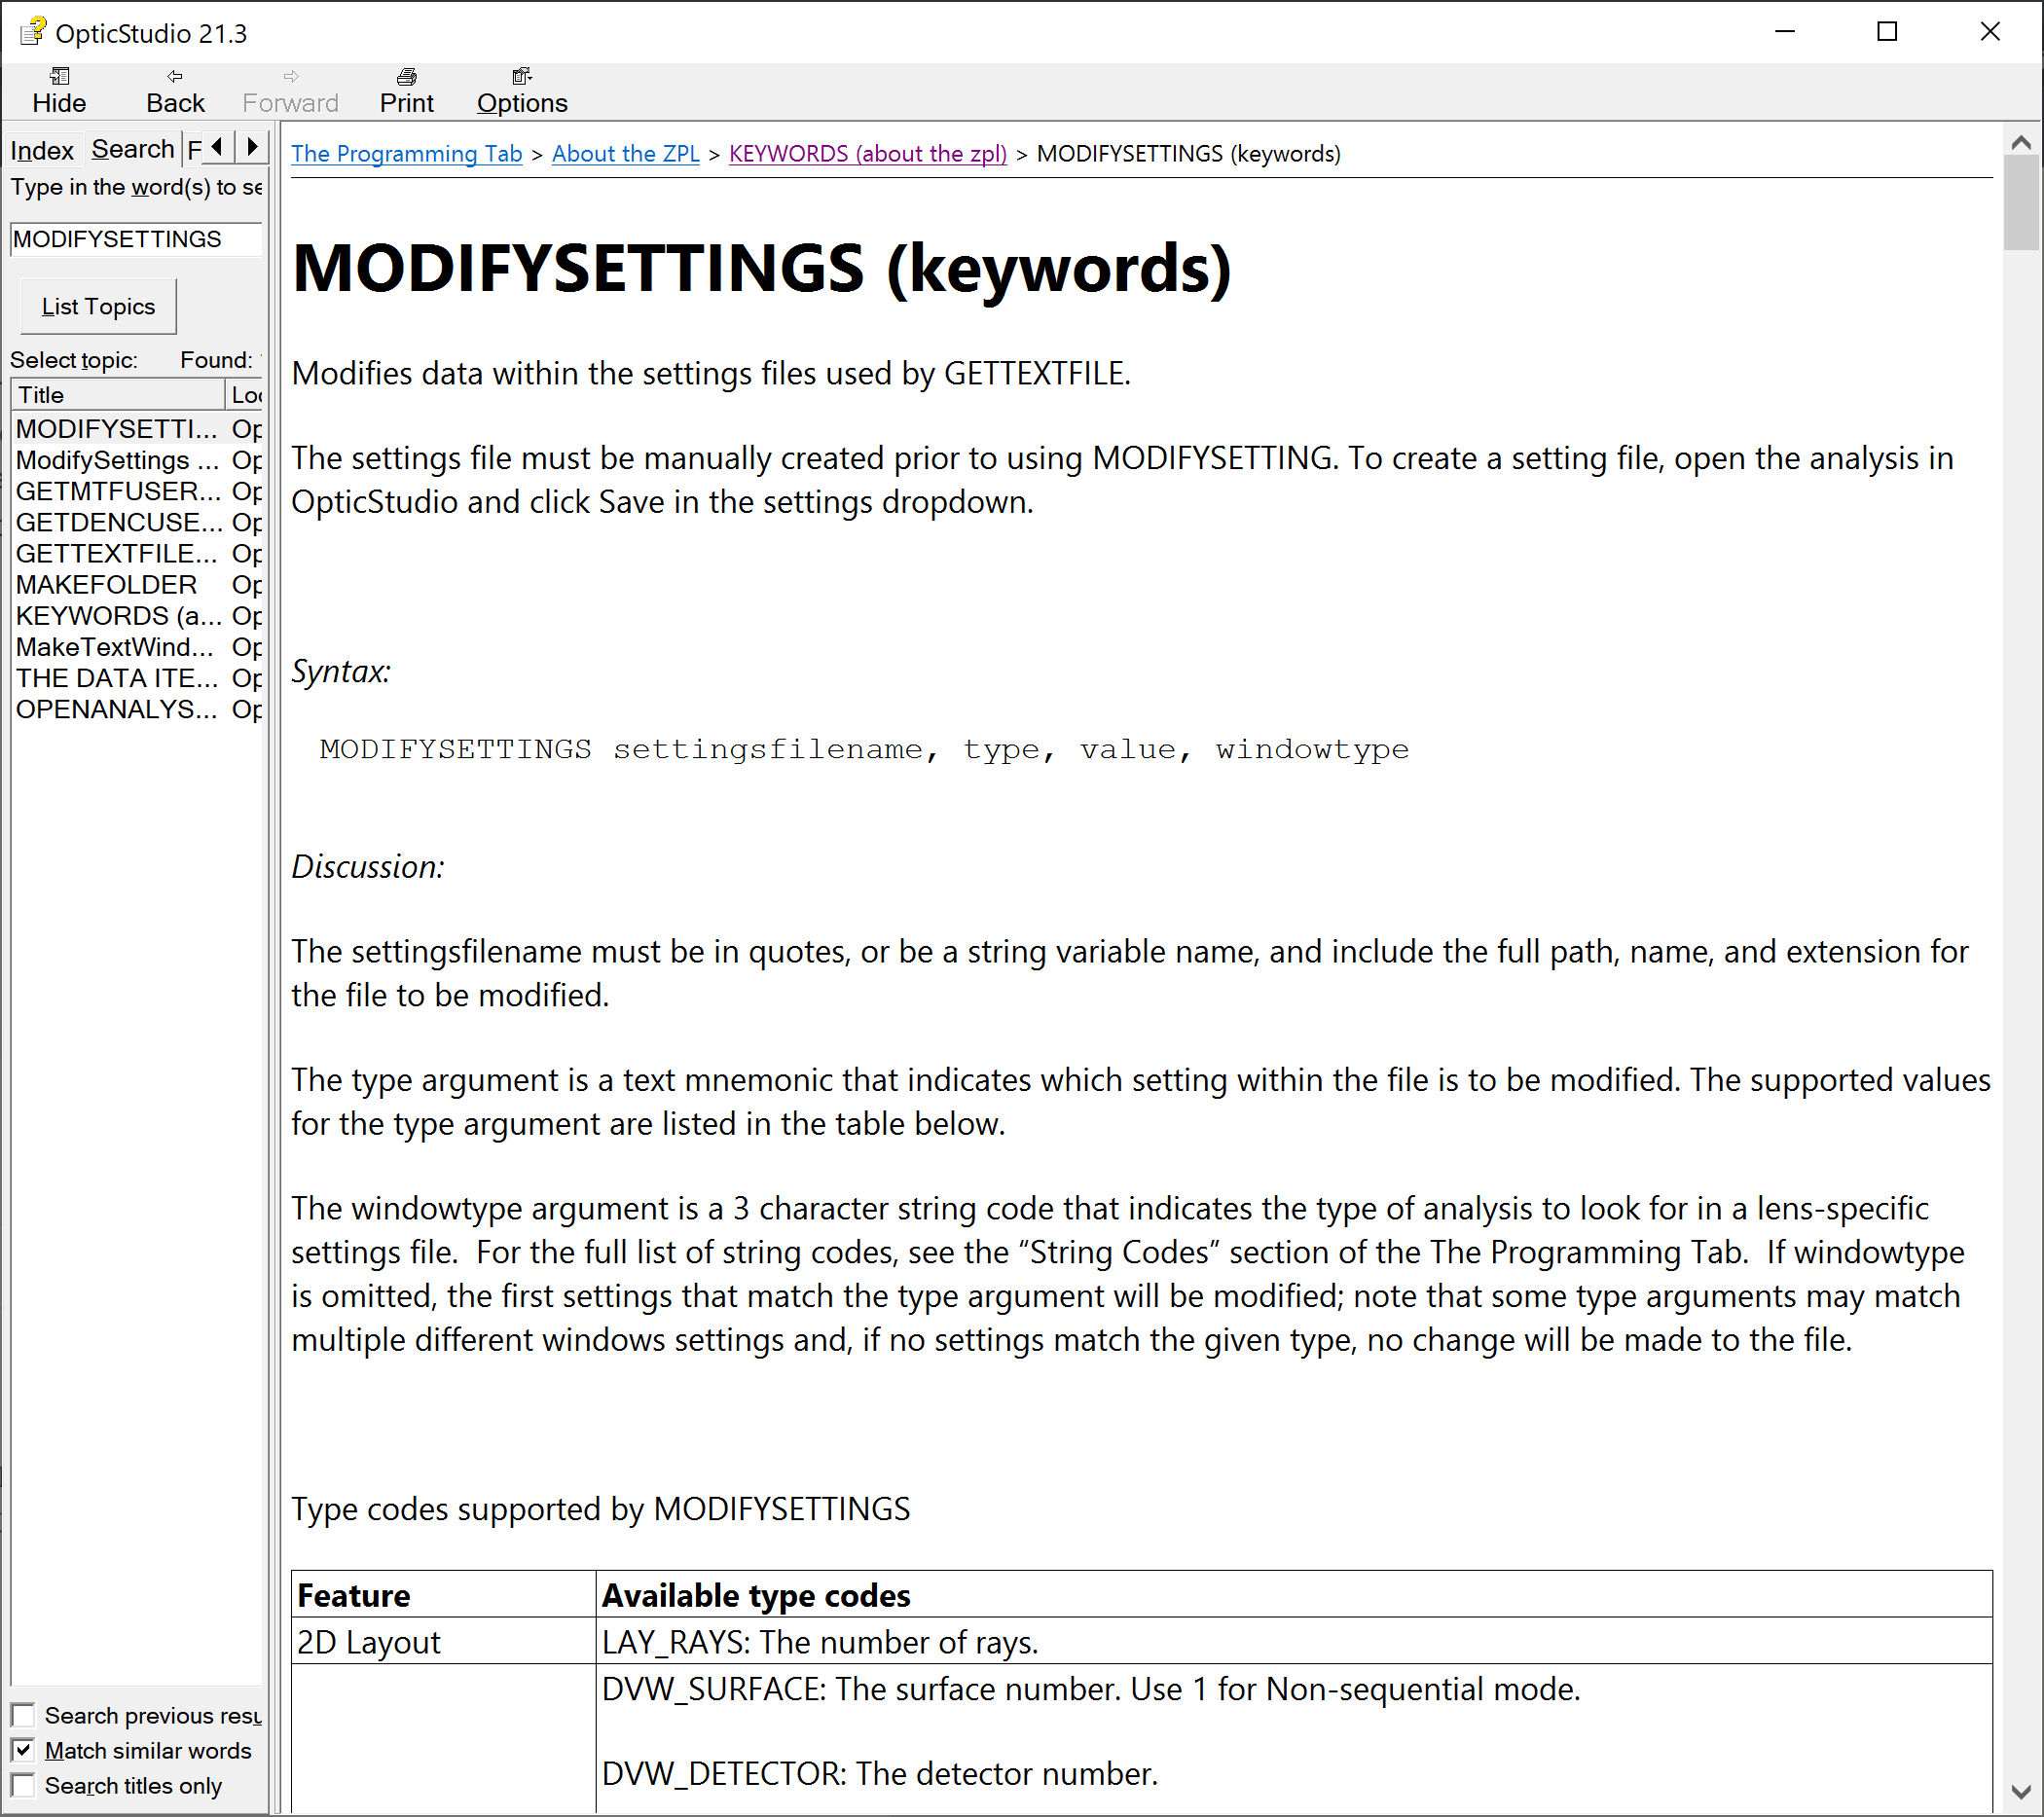
The first method can be used to save a settings file for your analysis. The second method can be used to load a particular settings file that has been saved previously. And the last method ModifySettings can be used to modify the settings in a settings file. The Code which you need can be found in the regular Help File (F1) under The Programming Tab > About the ZPL > KEYWORDS (about the zpl) > MODIFYSETTINGS (keywords). However, it doesn’t seem to have Codes for the Transmission Fan.

I hope this helps.

Take care,


David


Dear David,


thank you for your fast help!


Hence, I suppose that the only option is to either save the CFG-File before as desired and load it with the “Load”-function or to use the function “ModifySettings” to change it dynamically. Yet, as you mentioned there is no help for these functions in the Programming-Tab. Hence, is there any possibility to get a listing for the TypeCodes that can be provided as a string to “ModifySettings” to change a specific setting? Or is it not implemented at all yet and one has to wait until it will be provided in some future update?


Best regards,


Gregor


Dear Gregor,


The list of TypeCodes is found in the regular Help File (F1) under The Programming Tab > About the ZPL > KEYWORDS (about the zpl) > MODIFYSETTINGS (keywords) as mentioned in my post. Did you not find it? It should look as below:

Those settings might be implemented in the future, but this should be confirmed by Zemax’s staff.

What is it you are trying to achieve, maybe there’s another way without this analysis window? Or perhaps this analysis can be recoded with the ZOS-API if it is really essential for you?

Take care,


David


Dear David,


Yes, I found it but I didnt find  “Available Type Codes” for “Transmission Fan” (as you mentioned as well). There is still the alternative option to just trace the rays of the fan on my own. Yet, I thought this step can be simplified. 


At least, the possibility to change the settings with the  “ModifySettings”-function has been new for me. Thank you and best regards,


Gregor


Dear Gregor,


That’s right, these codes are missing, meaning they probably aren’t implemented yet. Not sure when they might be :(

Good luck with your application, and take care,


David


Hi Gregor and David, 

Yes, it looks like the Transmission Fan’s settings are not able to be edited programmatically. However, if you’re looking to pull a particular field or wavelength, that can be done by parsing through the Transmission Fan results. If you set Fields and Wavelengths to All then you will get all the data you need, and can cut the plot down to what you require. 

Alternatively, you can build your own plot with a Batch Ray Trace or by pulling the information from the CODA operand for multiple pupil coordinates. As you can see, CODA will report the same data as the Transmission Fan for a given field and pupil coordinate:


You could write a loop (similar to the one in this post) to report and extract the intensity values at a specific surface. Then you can plot the results. 


Reply