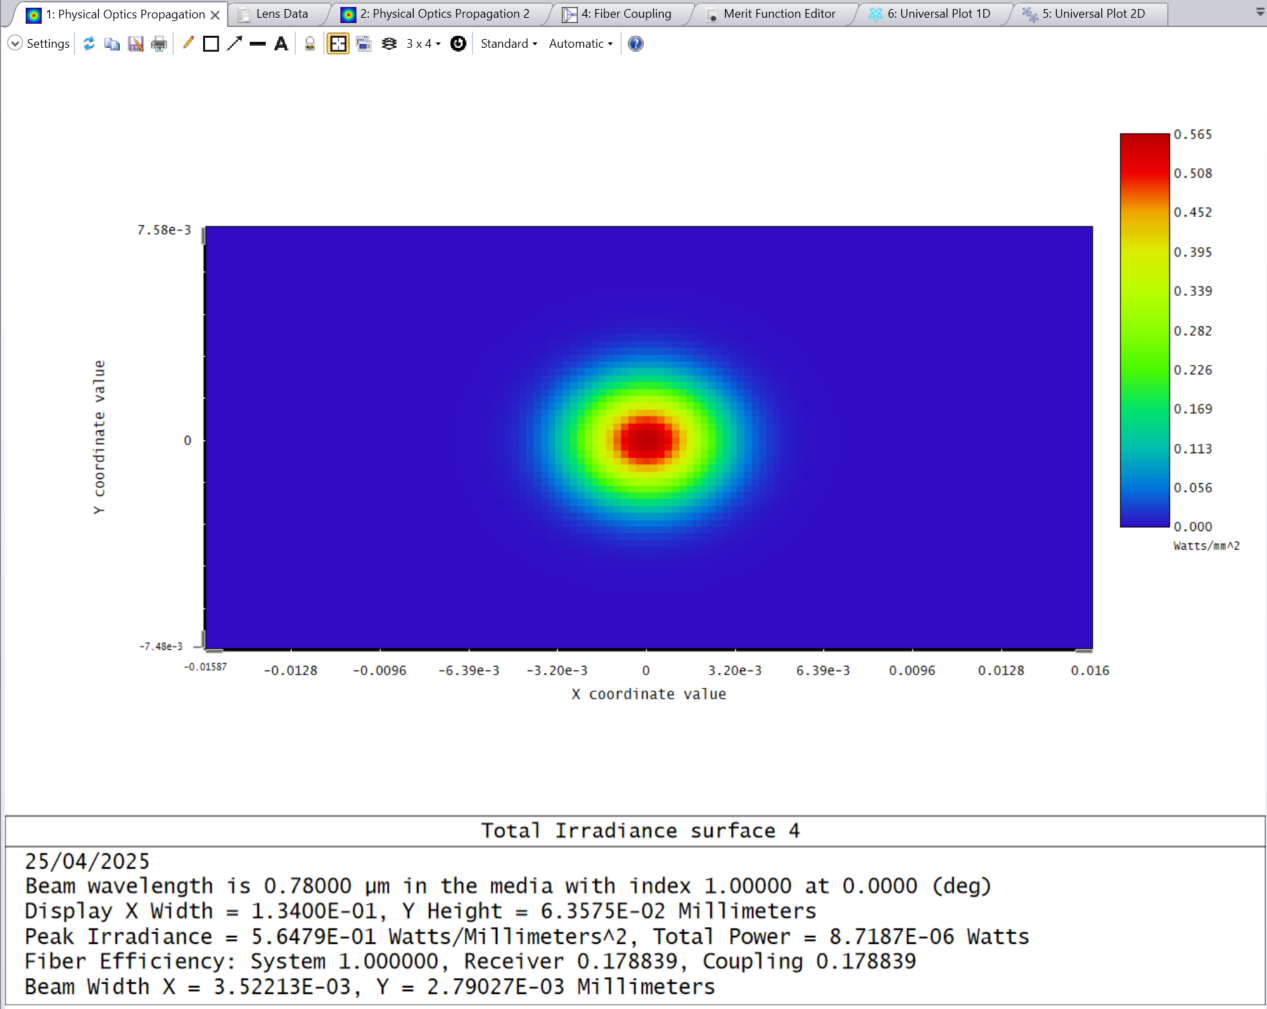
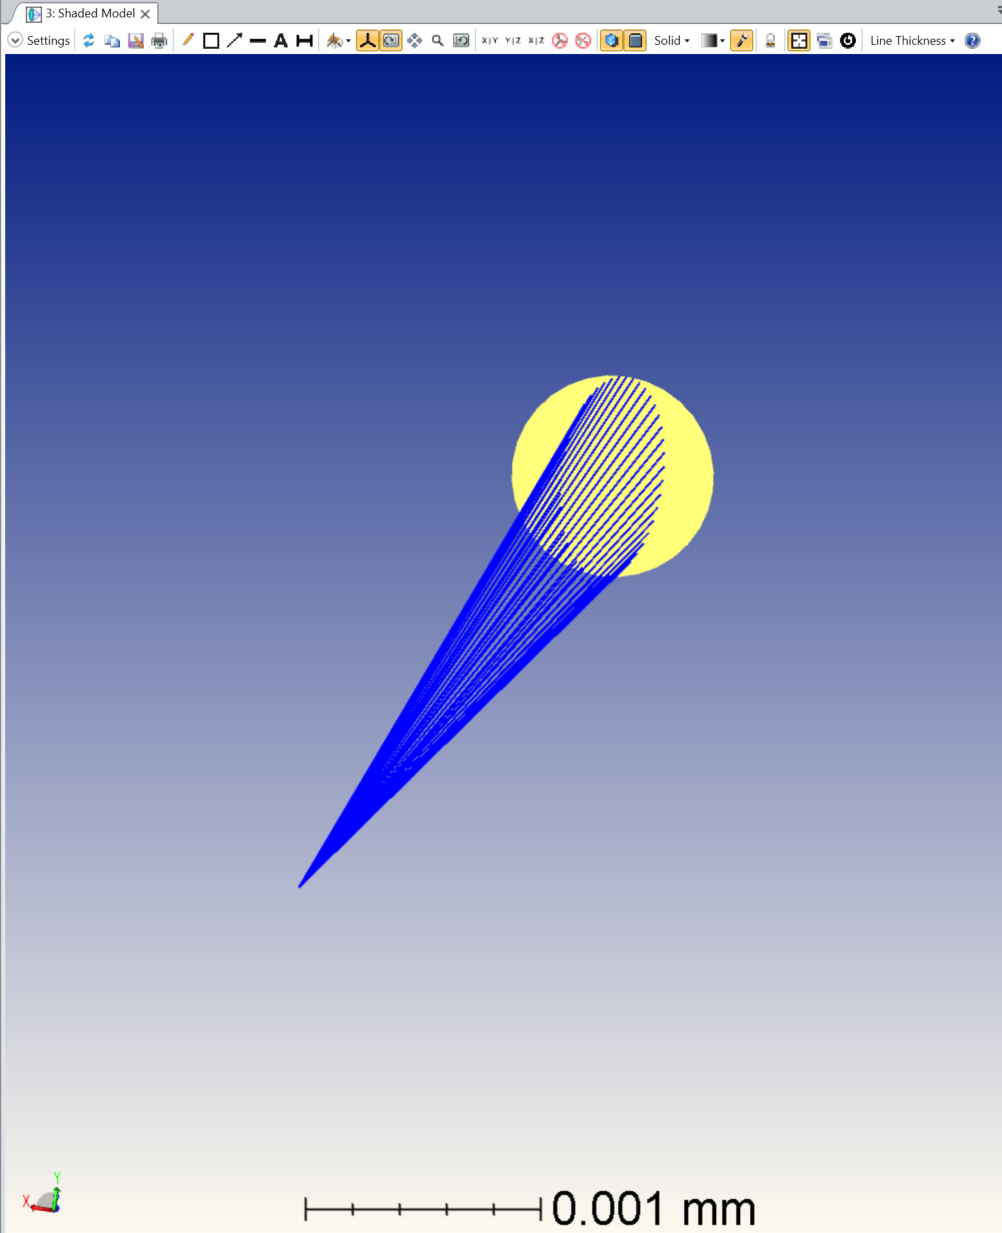
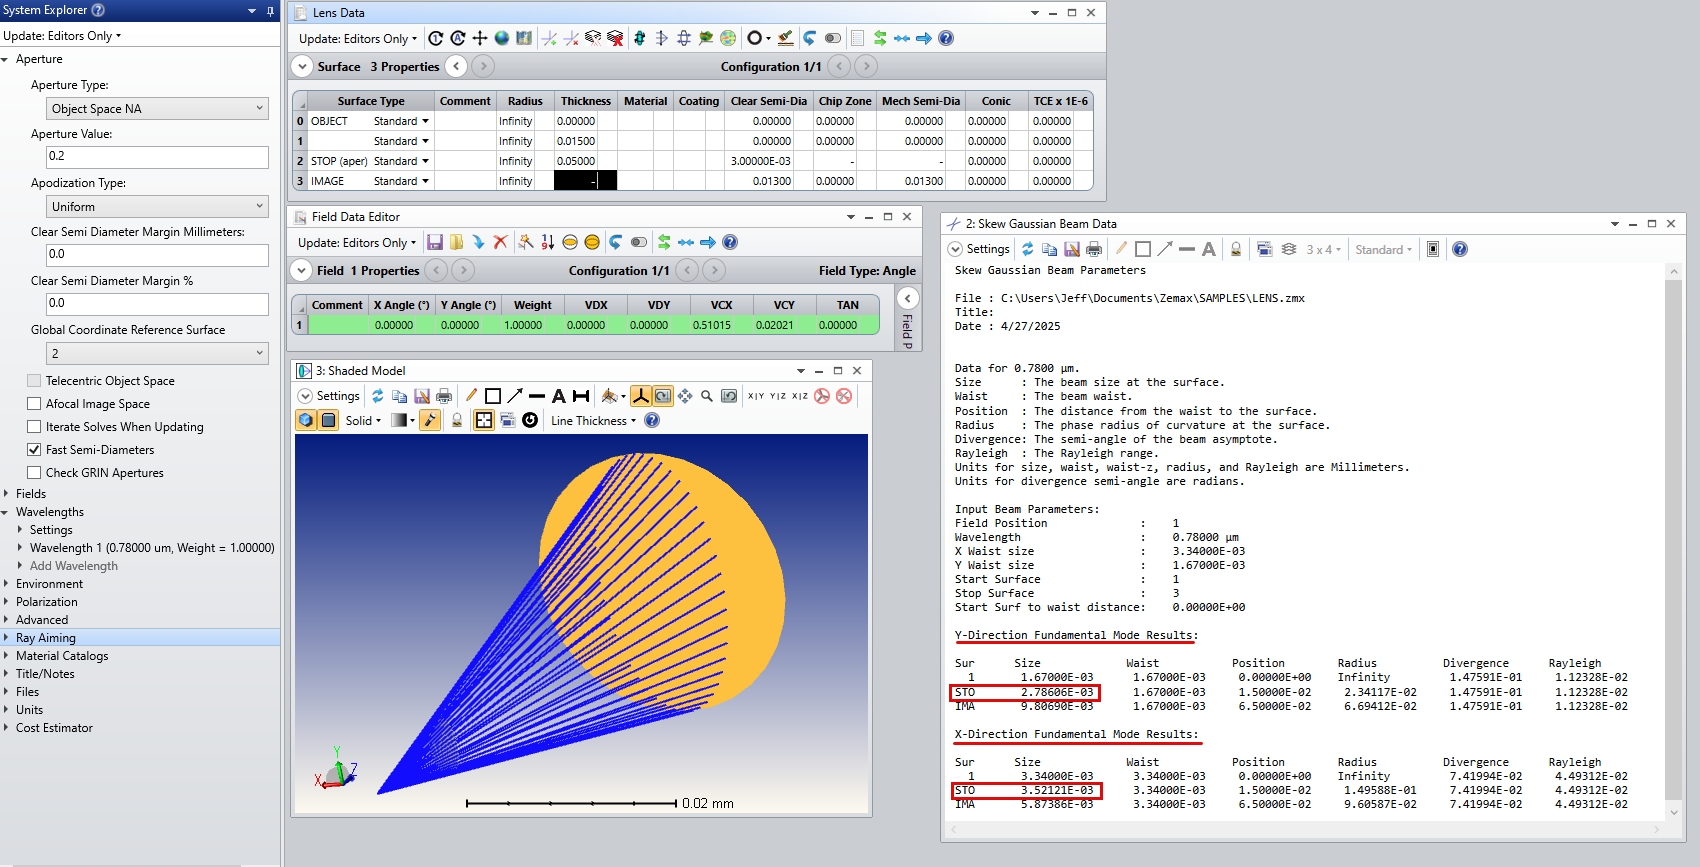
I have built a sequential model where I am trying to simulate how to edge-couple a 780nm laser diode to a thin-film lithium niobate waveguide (PPLN). I am using POP to calculate the coupling efficiency and have acquired a .zbf file from Lumerical that is the ‘output mode’ of the PPLN when running in the SHG mode, and using this as the ‘input’ data for the fibre overlap integral data. I believe I am getting reasonable answers but the beam profile graph is not showing the beam profile I would expect. The x and y half-angle divergences (in degrees) of the laser is 4.25 and 8.5, respectively. The beam profile at a distance of 15 microns from the laser shows a beam that is bigger in x than in y but only in the POP graph. in the 3D shaded model it is larger in y than in x, as I would expect from a DBR type laser. Can someone help me make sense of this?
The Rayleigh range of this beam is xR ~ 45 microns and yR ~ 11 microns, is the fact that I am looking at distances on the order the Rayleigh range, or less, pushing the limits of what Zemax can simulate?