How to calculate chromatic focal shift using ZEMAX macro?
Hi,
I would like to calculate the chromatic focal shift using ZEMAX macro. I know it is related with the back focal length and different wavelengths. However, I did not find such numerical functions or operands to do raytracing and get the back focal length.
Could anyone give any hint? Thank you.
Oliver
Page 1 / 1
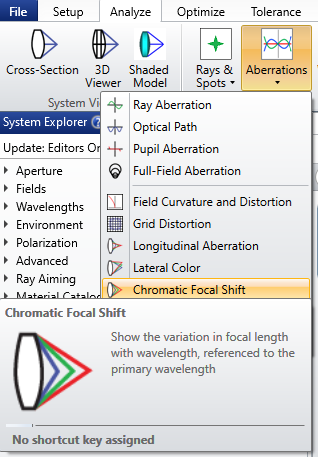
Have you tried using the built-in Chromatic Focal Shift analysis?
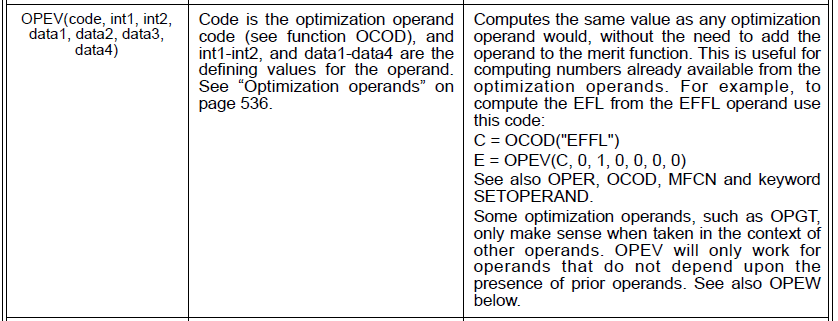
If you want to find the values using a ZPL macro, then one option would be to use the OPEV numeric function and call the “AXCL” operand to compute the axial chromatic focal shift between the primary wavelength and another second wavelength (or, in general, between any two wavelengths you like). Putting this in a loop and scanning the second wavelength would then allow you to construct the entire chromatic focal shift curve.
Have you tried using the built-in Chromatic Focal Shift analysis?
If you want to find the values using a ZPL macro, then one option would be to use the OPEV numeric function and call the “AXCL” operand to compute the axial chromatic focal shift between the primary wavelength and another second wavelength (or, in general, between any two wavelengths you like). Putting this in a loop and scanning the second wavelength would then allow you to construct the entire chromatic focal shift curve.
Dear Jeff,
Sorry for my late reply.
Yes, thank you. I tried the build in function and Macro. It works well in sequential mode, and two methods are in good accordance.
Here I attach the code:
C2 = OCOD("AXCL")

!Determine min and max wavelengths
nw = NWAV()
IF (nw == 1)
    PRINT "There is only one wavelength defined."
    GOTO End_Macro
ELSE
    minwav = 1
    maxwav = 1
    FOR i = 2, nw, 1
        IF (WAVL(minwav) > WAVL(i)) THEN minwav = i
        IF (WAVL(maxwav) < WAVL(i)) THEN maxwav = i
    NEXT
ENDIF

zone = 1
chromatic_focal_shift = OPEV(C2, minwav, maxwav, zone, 0, 0, 0)
PRINT "Chromatic focal shift is ", chromatic_focal_shift * 1000, "um on ", zone, " pupil size"

LABEL End_Macro
PRINT "Program End"
END
Of course, I know for some lens system, for example, doublet, the focal shift curve does not keep decreasing or increasing as the wavelength increases. This is another problem in my code.
But I can see that the results of two methods are not the same in non-sequential mode or hybrid-mode, or some systems with coordinate break. Do you have any suggestions?
Thank you.
Oliver
Hi Oliver,
Glad your macro is working. By scanning wavelengths across your source bandwidth you can generate the entire chromatic focal shift curve and calculate the corresponding maximum deviation, just as is done with the built-in analysis tool.
In any event, for your question above please see my recent response to your related post: