


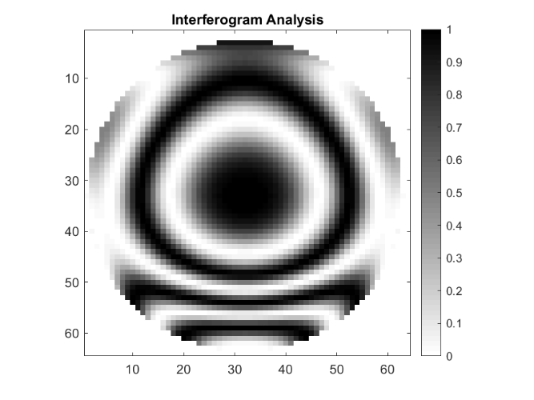
This MATLAB standalone code imports data from the Interogram analysis feature, plots the Interferogram data as a MATLAB figure and saves it as a png file. This code was written by Michael Humphreys.
Language: Matlab
Click here to download | |||
|---|---|---|---|
| Date | Version | OpticStudio Version | Comment |
| 2020/01/14 | 1.0 | 19.8 | Creation |