Why the polychromatic MTF is further degraded than the MTF at the individual wavelengths?

  • 25 February 2020
  • 18 replies
  • 526 views

Userlevel 3
Badge +2

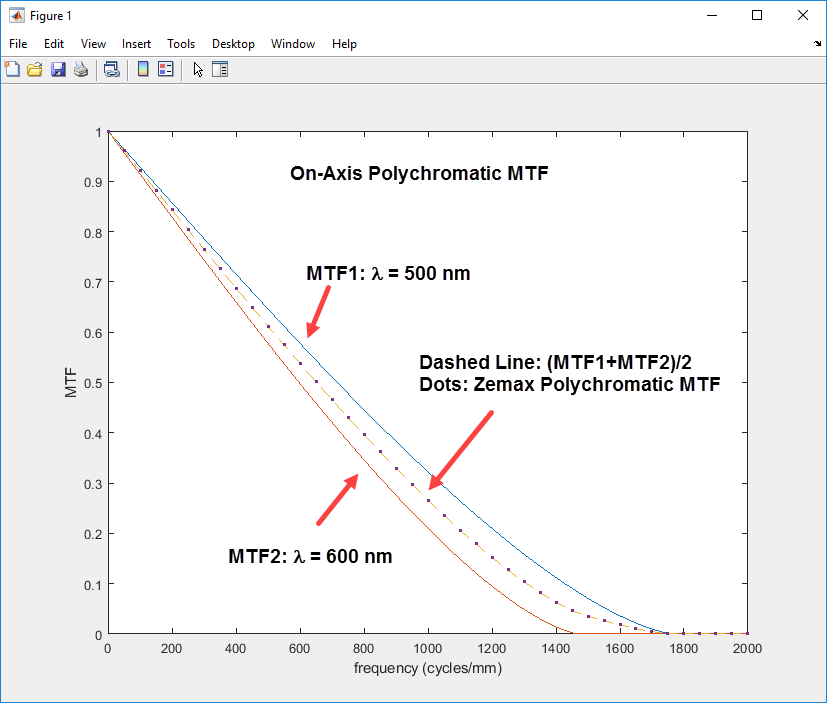
While the MTF at each individual wavelength in your system may be good, if the system has some chromatic aberration then this means that the individual wavelengths are offset from each other. Therefore, when the results of the individual wavelengths are combined you will get a reduced value of the polychromatic MTF.


Let's say, for example, that you have excellent monochromatic modulation, say 90% at each of three wavelengths individually. But if you have lateral color, the peaks and valleys of each wavelength are offset from each other. The polychromatic intensity modulation gets reduced since it never goes as low as the individual monochromatic intensities do. So you may get a much lower modulation, like 40% polychromatically.


18 replies

Hi Berta, thanks for this post. I’m looking for information on how the polychromatic MTF is calculated over wavelengths. In particular, I’d like to know how the polychromatic MTF is combined as a function of its constituent wavelengths.  I would also like to know whether there is any interpolation that happens between discrete wavelengths specified for the system.  When I see on the footer for the MTF plot “Data for X to Y” it could imply some interpolation or not, so I’d like to be certain about this.  I was having difficulty finding an equation for this in the docs...can someone please help?

N

Userlevel 7
Badge +3

I’d suggest Goodman’s book on Fourier optics as the classic reference on this.

  • Mark

Thanks Mark, though I can still see various ways in which Goodman’s definition could be applied to a lens in OpticStudio.  Maybe I should be more specific about my concern.  For example, would a system with three wavelengths have MTF calculated for delta functions in the spectral domain over which performance is integrated? Or would there be some finite bandwidth integrated over for a continuum of wavelengths between the three specified ones? I’m basically asking whether there is any part of the polychromatic MTF calculation which assumes more wavelengths than those I specifically typed in as system wavelengths.  Hope this better clarifies my concern,

Thanks

N

Userlevel 7
Badge +3

Hi Nick,

Ah, I see. OS does not use any intermediate wavelengths: it only uses the ones you specify.

  • Mark
Userlevel 7
Badge +3

@Nick Kochan  I was thinking more about your question and came up with a simple model to illustrate that the polychromatic MTF is based on the set of discrete system wavelengths as defined in the System Explorer.  I’ve attached a short write-up.  It’s a fairly straightforward exercise in Fourier optics. 

Regards,

Jeff

Thanks @Mark.Nicholson for the updated reply...this does indeed answer my question.

And @Jeff.Wilde this is a nice and simple example I can test based in theory - thanks for providing!

Mark and Jeff's discussion was instructive, but I guess the question is how is the on-axis field of view done? We know that the image height of each wavelength in the on-axis field of view is 0, and there is no positional chromatic aberration. How does zemax do a weighted average of the MTF for this case?

Userlevel 7
Badge +3

@Haokun.Ye   For the on-axis case, the polychromatic MTF in OpticStudio is just the average of the individual MTF functions for the separate system wavelengths.  Below is a two-wavelength example (from my grating example model in which I simply selected the Diffraction Order = 0).  I first computed the two individual MTF functions and imported the data to Matlab, then plotted them along with the average.  Lastly, I directly computed the polychromatic MTF in OpticStudio (by selecting Wavelength = All), imported the data and added it to the plot.  You can see the average value version overlays exactly with the polychromatic version.


Regards,

Jeff

Thanks for your reply, but when I use a slightly more complicated system, some problems arise.

As shown in the figure, I set three wavelengths for a COOKE system, and the weights are 1, 2, 1. The monochromatic MTFs are the red, green, and blue curves respectively. The result of my direct weighting is a circle, and the result of zemax calculation is the dotted line. Obviously, this is not in line with our intuition.

The system I will be using is uploaded as an attachment. Hope you can help.

Ye

Userlevel 7
Badge +3

@Haokun.Ye  Okay, your example helps me understand your question better.  Remember that the polychromatic system OTF is the normalized Fourier transform of the sum of the intensity point spread functions (one intensity PSF per system wavelength).  Therefore, the system OTF is a complex quantity.  The system MTF is the magnitude of the OTF.  When computing a weighted average of the individual OTF functions, the phase must be taken into account (i.e., at each spatial frequency we should average the corresponding complex numbers for the individual OTFs).  For a real lens system with aberrations, the individual OTFs will have phase values that vary as a function of spatial frequency.  Here is an example using the Cooke Triplet 40-deg. model that comes with OpticStudio.


While I haven’t tried it, my guess is that if you compute the weighted average of the complex OTF functions, then take the magnitude, you will find the same polychromatic MTF result that OpticStudio calculates.

Jeff

Very good explanation!
But then a new question arises, how does the PSF add up? We know that the spacing of the PSF grid is different for different wavelengths, do we need to re-interpolate the grid?
In addition, we generally normalize the PSF to 100, so when we stack, do we need to stack the peak-normalized PSF, or the total energy value-normalized PSF?
regards
Ye

@Haokun.Ye  Okay, your example helps me understand your question better.  Remember that the polychromatic system OTF is the normalized Fourier transform of the sum of the intensity point spread functions (one intensity PSF per system wavelength).  Therefore, the system OTF is a complex quantity.  The system MTF is the magnitude of the OTF.  When computing a weighted average of the individual OTF functions, the phase must be taken into account (i.e., at each spatial frequency we should average the corresponding complex numbers for the individual OTFs).  For a real lens system with aberrations, the individual OTFs will have phase values that vary as a function of spatial frequency.  Here is an example using the Cooke Triplet 40-deg. model that comes with OpticStudio.


While I haven’t tried it, my guess is that if you compute the weighted average of the complex OTF functions, then take the magnitude, you will find the same polychromatic MTF result that OpticStudio calculates.

Jeff

Very unfortunate, I tried, first of all the OTF grids have different spacing for different wavelengths, I may need to interpolate the OTF, I can't confirm if it is possible to interpolate complex numbers. However, even if I did this, it didn't match zemax, but rather the result of direct weighted average.
regards
Ye

I tried to calculate PolyChromatic MTF by ASF, PSF, MTF, OTF, but always can't match. Very interesting question! Our intuition doesn't seem right.
Regards.
Ye

Userlevel 7
Badge +3

@Haokun.Ye   I think the approach I describe above does work.  To test it, I went ahead and used the Cooke example model to generate the complex OTFs for the three system wavelengths.  Note that by setting the “Maximum Frequency” parameter for the MTF analysis to some non-zero value, all MTFs will use the same sampling, independent of wavelength -- so no interpolation is needed.

In Matlab I computed the weighted average of these complex OTFs (using the system wavelength weights), then evaluated the corresponding MTF (= normalized magnitude of the system OTF).  I then compare this to the polychromatic MTF computed directly by Zemax.  Here are the results:


As you can see, the agreement is good.  There is some numerical noise on the MTF curve found by averaging of the three wavelength contributions, but it’s not too bad.  I suspect in Zemax the MTF analysis is actually done by taking the Fourier transform of the polychomatic PSF function, which may not have this “noise” artifact.

Jeff

Fantastic...
Can I get your code, I think I need to compare to see where I am going wrong.

Regards.

Ye

Userlevel 7
Badge +3

First, I just cut and paste the data values from the MTF text output into Matlab (frequency, magnitude and phase for each wavelength as well as for the overall polychromatic MTF).  Then I used the following simple script to compare the results:

Jeff

Thank you for your help! Very intuitive explanation. I found my previous mistake, I interpolated the OTF due to different frequency steps for different wavelengths and it seems that information is lost in this step. thank you very much! I will study further and look forward to further communication with you.

Reply