


Introduction
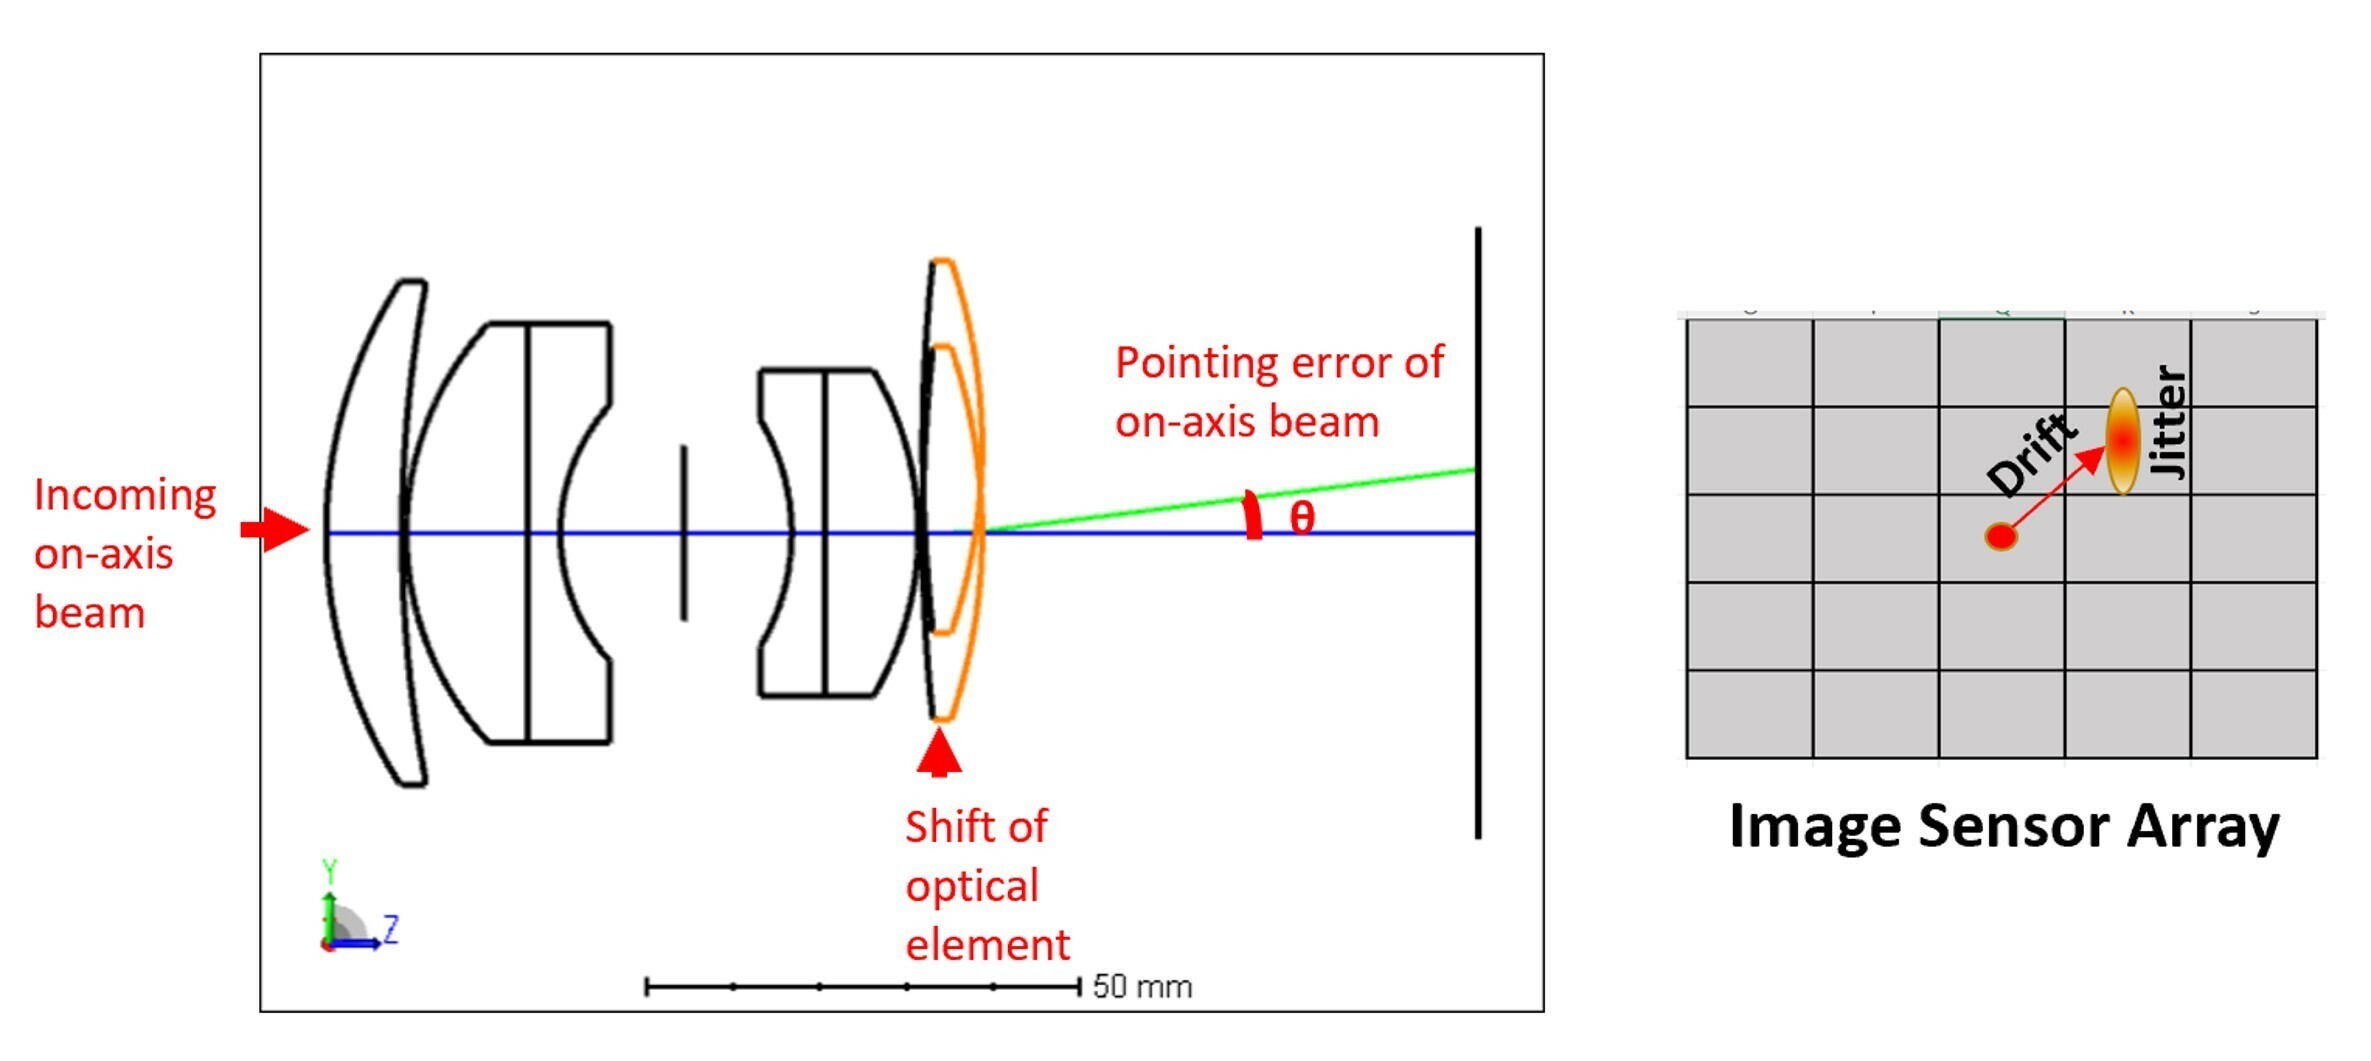
Optical systems are often subject to random vibrations due to internal and external disturbances. This causes elements to shift position and as a result the formed image also moves around on sensor. This movement of the beam is referred to as the Line-of-sight jitter. Jitter due to vibration can lead to system performance degradation, specifically line-of-sight error, image distortion, and loss of image resolution.
In a sense any optical systems operating under field conditions are likely to experience some levels of structural vibration. But jitter analysis is particularly important for applications in the Aerospace & Defense and Automotive industries, for example, a head-up display mounted in a car driving on a bumpy road, a camera mounted on an aircraft in flight, a space telescope launched in orbit observing earth or other celestial objects. Vibrations exist in these systems and degrade the system performance. In an imaging system where image registration and resolution are of key importance, image motion beyond the pixel pitch or a fraction of a pixel may lead to image blurring and distortion. Similarly in a laser communication system, jitter in Line-of-sight can lead to loss of tracking and data bandwidth reduction. Therefore, jitter analysis plays an important role in these applications. It’s a Multiphysics and multidisciplinary system engineering task that requires collaboration among optical, mechanical, structural, and system engineers. They need to work together to better understand jitter impact on performance and to maintain the magnitude of Line-of-sight jitter within a specific limit so the product can deliver satisfactory performance under real operating conditions. [1, 2]
Line-of-sight (LOS) error, also called pointing error, describes the error in the pointing direction of the beam due to motion of the system. There are two types of LOS errors that are typically considered. The first one is the LOS drift, or DC pointing error which is a slow effect that mainly affects the image location. The second is Jitter, or AC pointing error caused by high-frequency vibrations. This high-frequency jitter tends to cause bigger PSF blur, lower MTF, and loss of image resolution [1, 2]. The concept of low or high frequency jitter are relative to the exposure time or sensor integration time. For example, if the sensor integration time is 20ms, any vibration modes with a frequency higher than 50Hz will have completed one or even multiple motion cycles within one sensor integration time. This image motion leaves a bigger PSF blur on the sensor and smears the image. But for the low frequency motions, the image drifts slowly and may have only moved very slightly within one integration time so there’s little impact on the PSF. However, given time the image may shift significantly away from the center of the sensor array, so the main concern now becomes image registration error, instead of image resolution loss.
Keeping this in mind, we have separated the jitter discussion into two parts. This article is part I of this jitter series. It introduces a workflow that targets the low-frequency, slow drift of the image due to thermal effects. Later we will publish another article discussing the solution for high-frequency jitter impact on PSF and MTF performance.
Ansys Multiphysics Solutions
Ansys complete suite of simulation software packages provide an end-to-end solution for optical and optomechanical design, structural and thermal FEA analysis, and STOP analysis. It enables users to incorporate structural and thermal assessment early in the design stage for more realistic modeling of performance on the system level. This not only helps designers catch critical issues early on, but also helps cut costs on prototyping and testing and shorten product to market time.
System Setup
To study the low frequency LOS drift due to thermal effects, we use a CubeSat space telescope as an example. CubeSats are miniaturized satellites launched into orbit for scientific research including earth imaging or observation of other celestial objects. They are compact, lightweight, and come in a 10cmx10cmx10cm cube unit.
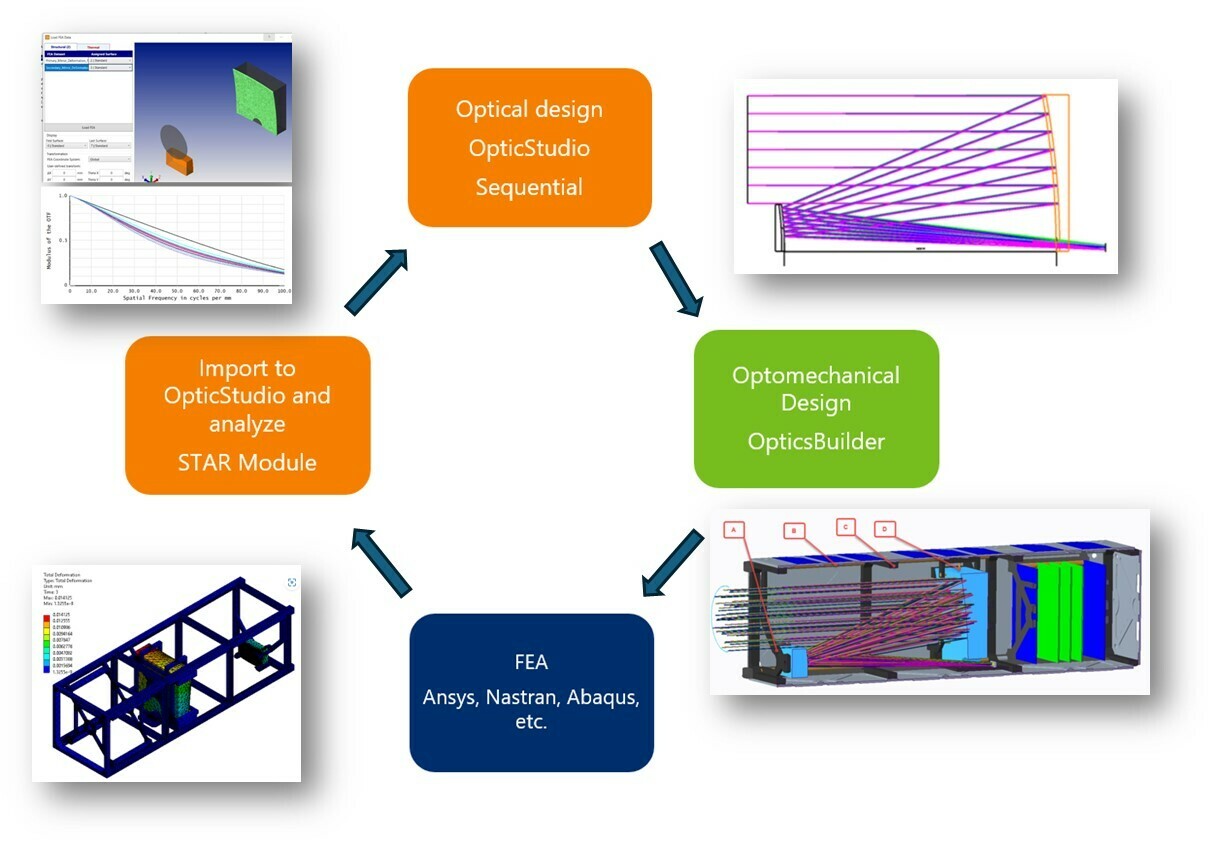
The optical system in this example is a reflective telescope consisting of a Primary mirror and a Secondary mirror forming image on an image sensor. The optical system is designed using Ansys Zemax OpticStudio. After design and optimization, the system is exported via OpticsBuilder and brought into a CAD platform CREO Parametric. There optomechanical structures of the CubeSat can be designed. Next, the entire CubeSat assembly is brought into Ansys Mechanical, a structural and thermal Finite Element Analysis (FEA) solver for FEA analysis. In Mechanical, contacts between the optics and optomechanical parts are defined and mesh structures created for FEA analysis, with each mirror surface represented by at least 10,000 mesh nodes to ensure good data quality to use with OpticStudio STAR module later on.
The entire optical, optomechanical, and structural FEA workflow up to this point are described in detail in this Knowledgebase article series written by Jordan Teich, Flurin Herren, and Matthias Schlich, From Concept to CubeSat Part 1: Using Ansys Zemax Software to Develop a CubeSat System – Knowledgebase. This KBA series serves as a great tutorial for optical and optomechanical engineers who are interested in STOP workflow.
Analysis & Results
In this workflow we will analyze the slow drift of the Line-of-sight or image centroid, introduced by the gradual heating and cooling of the CubeSat operating environment. Once deployed in orbit, the unit may experience heat loads from sun radiation or other sources onboard. This may lead to fluctuation in the operating temperature. The assumption is made that the CubeSat’s radiation control system would insulate the optics from large fluctuations in temperature, limiting the operating temperature range of the optics to 15C +/- 3C.
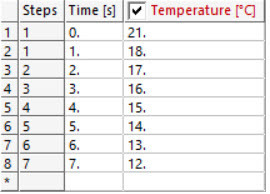
In this example, when performing structural & thermal FEA analysis, we assume the only load present is a thermal condition that causes the components to expand according to their coefficient of thermal expansion (CTE). Discrete temperature conditions were chosen to resemble the operating temperature range that the CubeSat would experience during Low Earth Orbit operation. The detailed consideration for the thermal FEA analysis can be found in this Knowledgebase article written by Matthias Schlich and Jordan Teich, From Concept to CubeSat Part 3: Using the Ansys Zemax Software Suite to Develop a CubeSat System – Knowledgebase.
The nominal optical system is designed in OpticStudio at ambient temperature 21C. This is the reference temperature at which the geometry is defined.
The temperatures were implemented in Ansys Mechanical as follows:
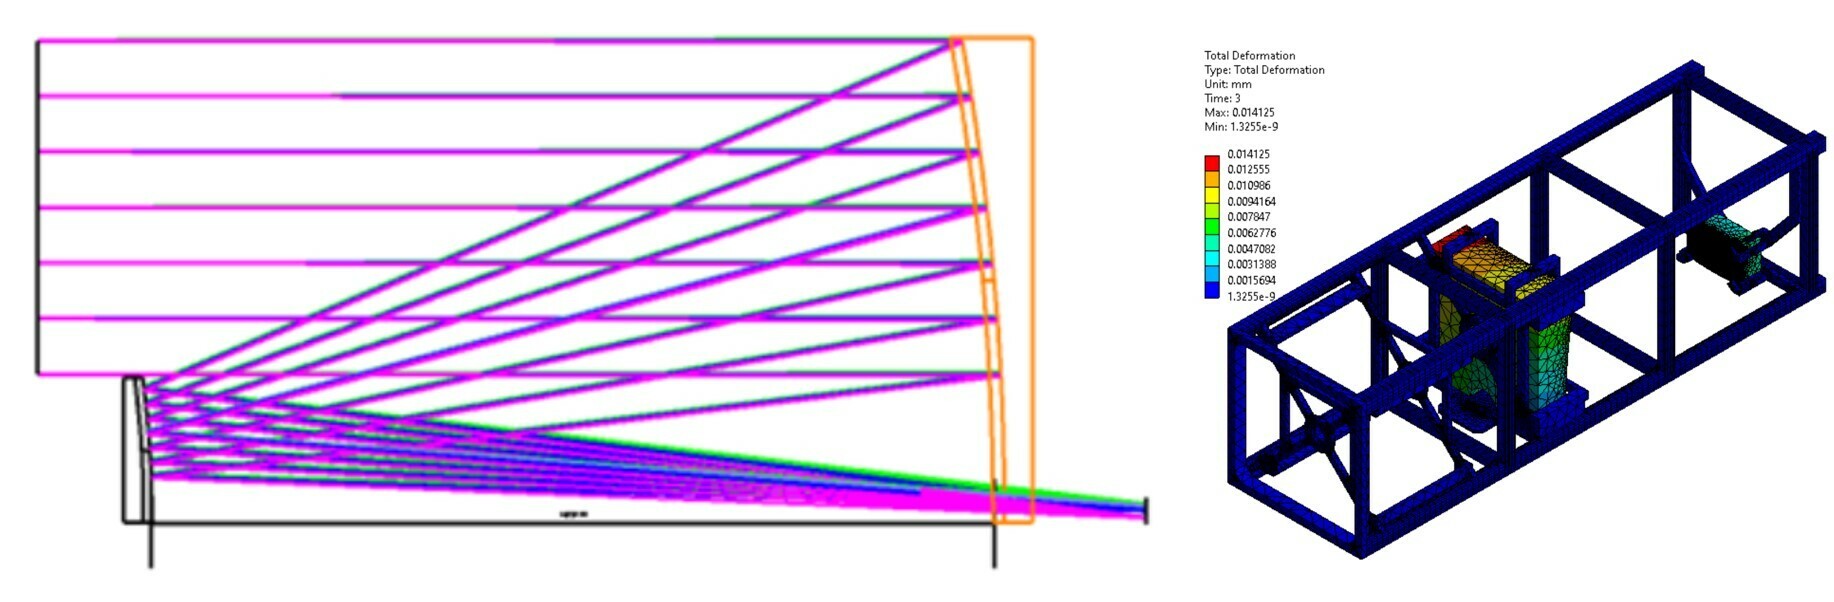
The dominating deformation effect observed in this system is caused by the mirrors shrinking due to the high CTE of the aluminum substrate. With the FEA analysis completed, the structural deformation data for both mirror surfaces can now be exported for all operating temperatures. Using the provided Ansys ACT extension, OpticStudio STAR Module: Ansys Data Export Extension, this data can be exported to a series of text files. These text files contain 6 data columns. The first 3 columns represent the initial mesh node position x, y, z, and the last 3 columns represent the movement of each node, Δx, Δy, Δz. These text files describing structural deformation are all that is needed to import the FEA data into OpticStudio’s STAR module for further analysis.
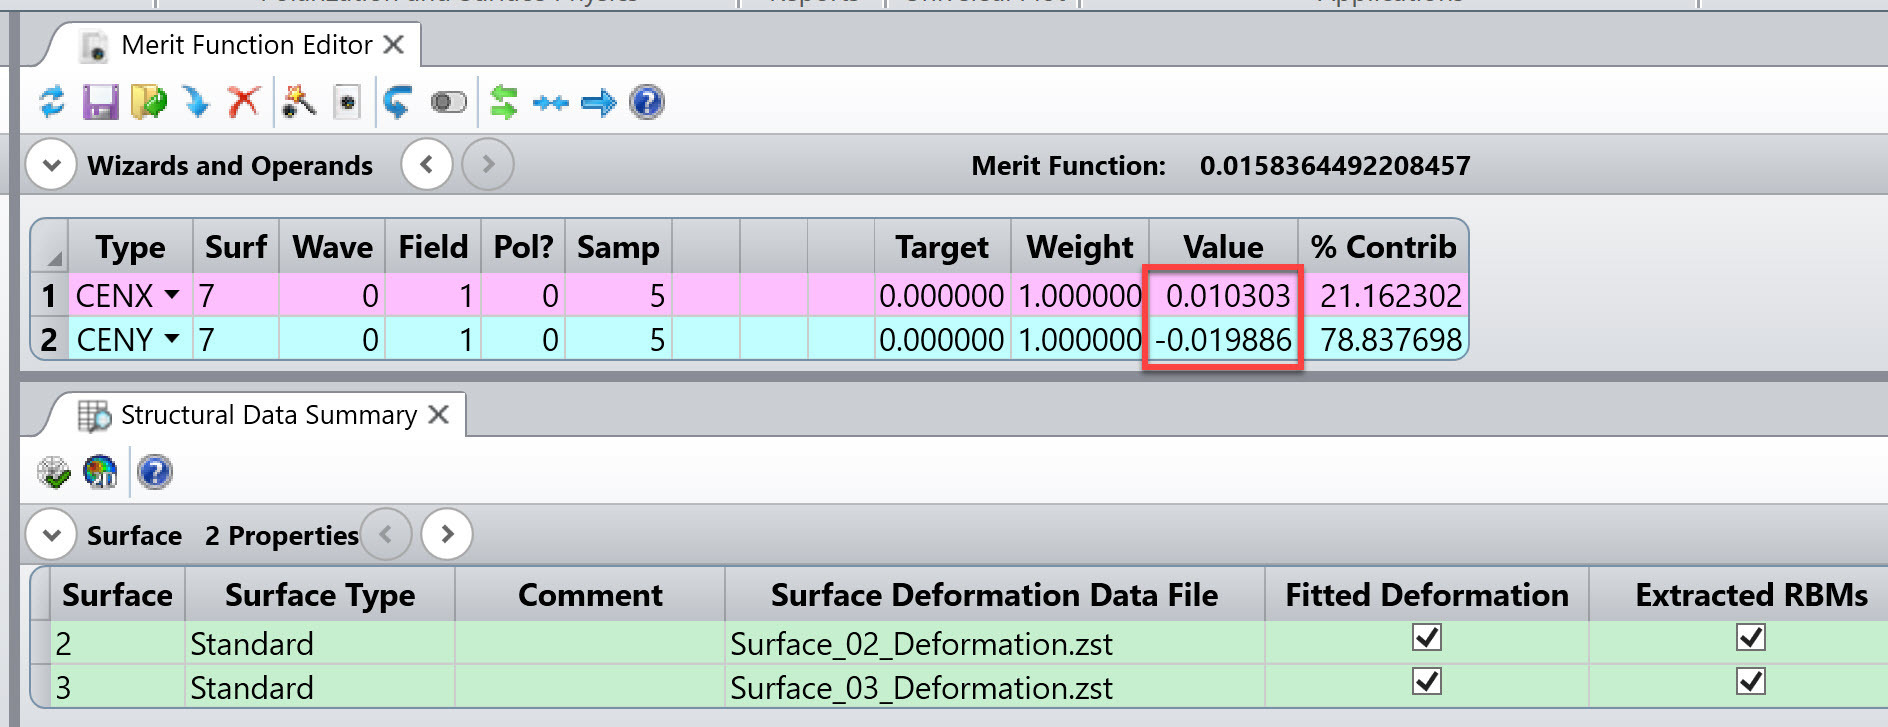
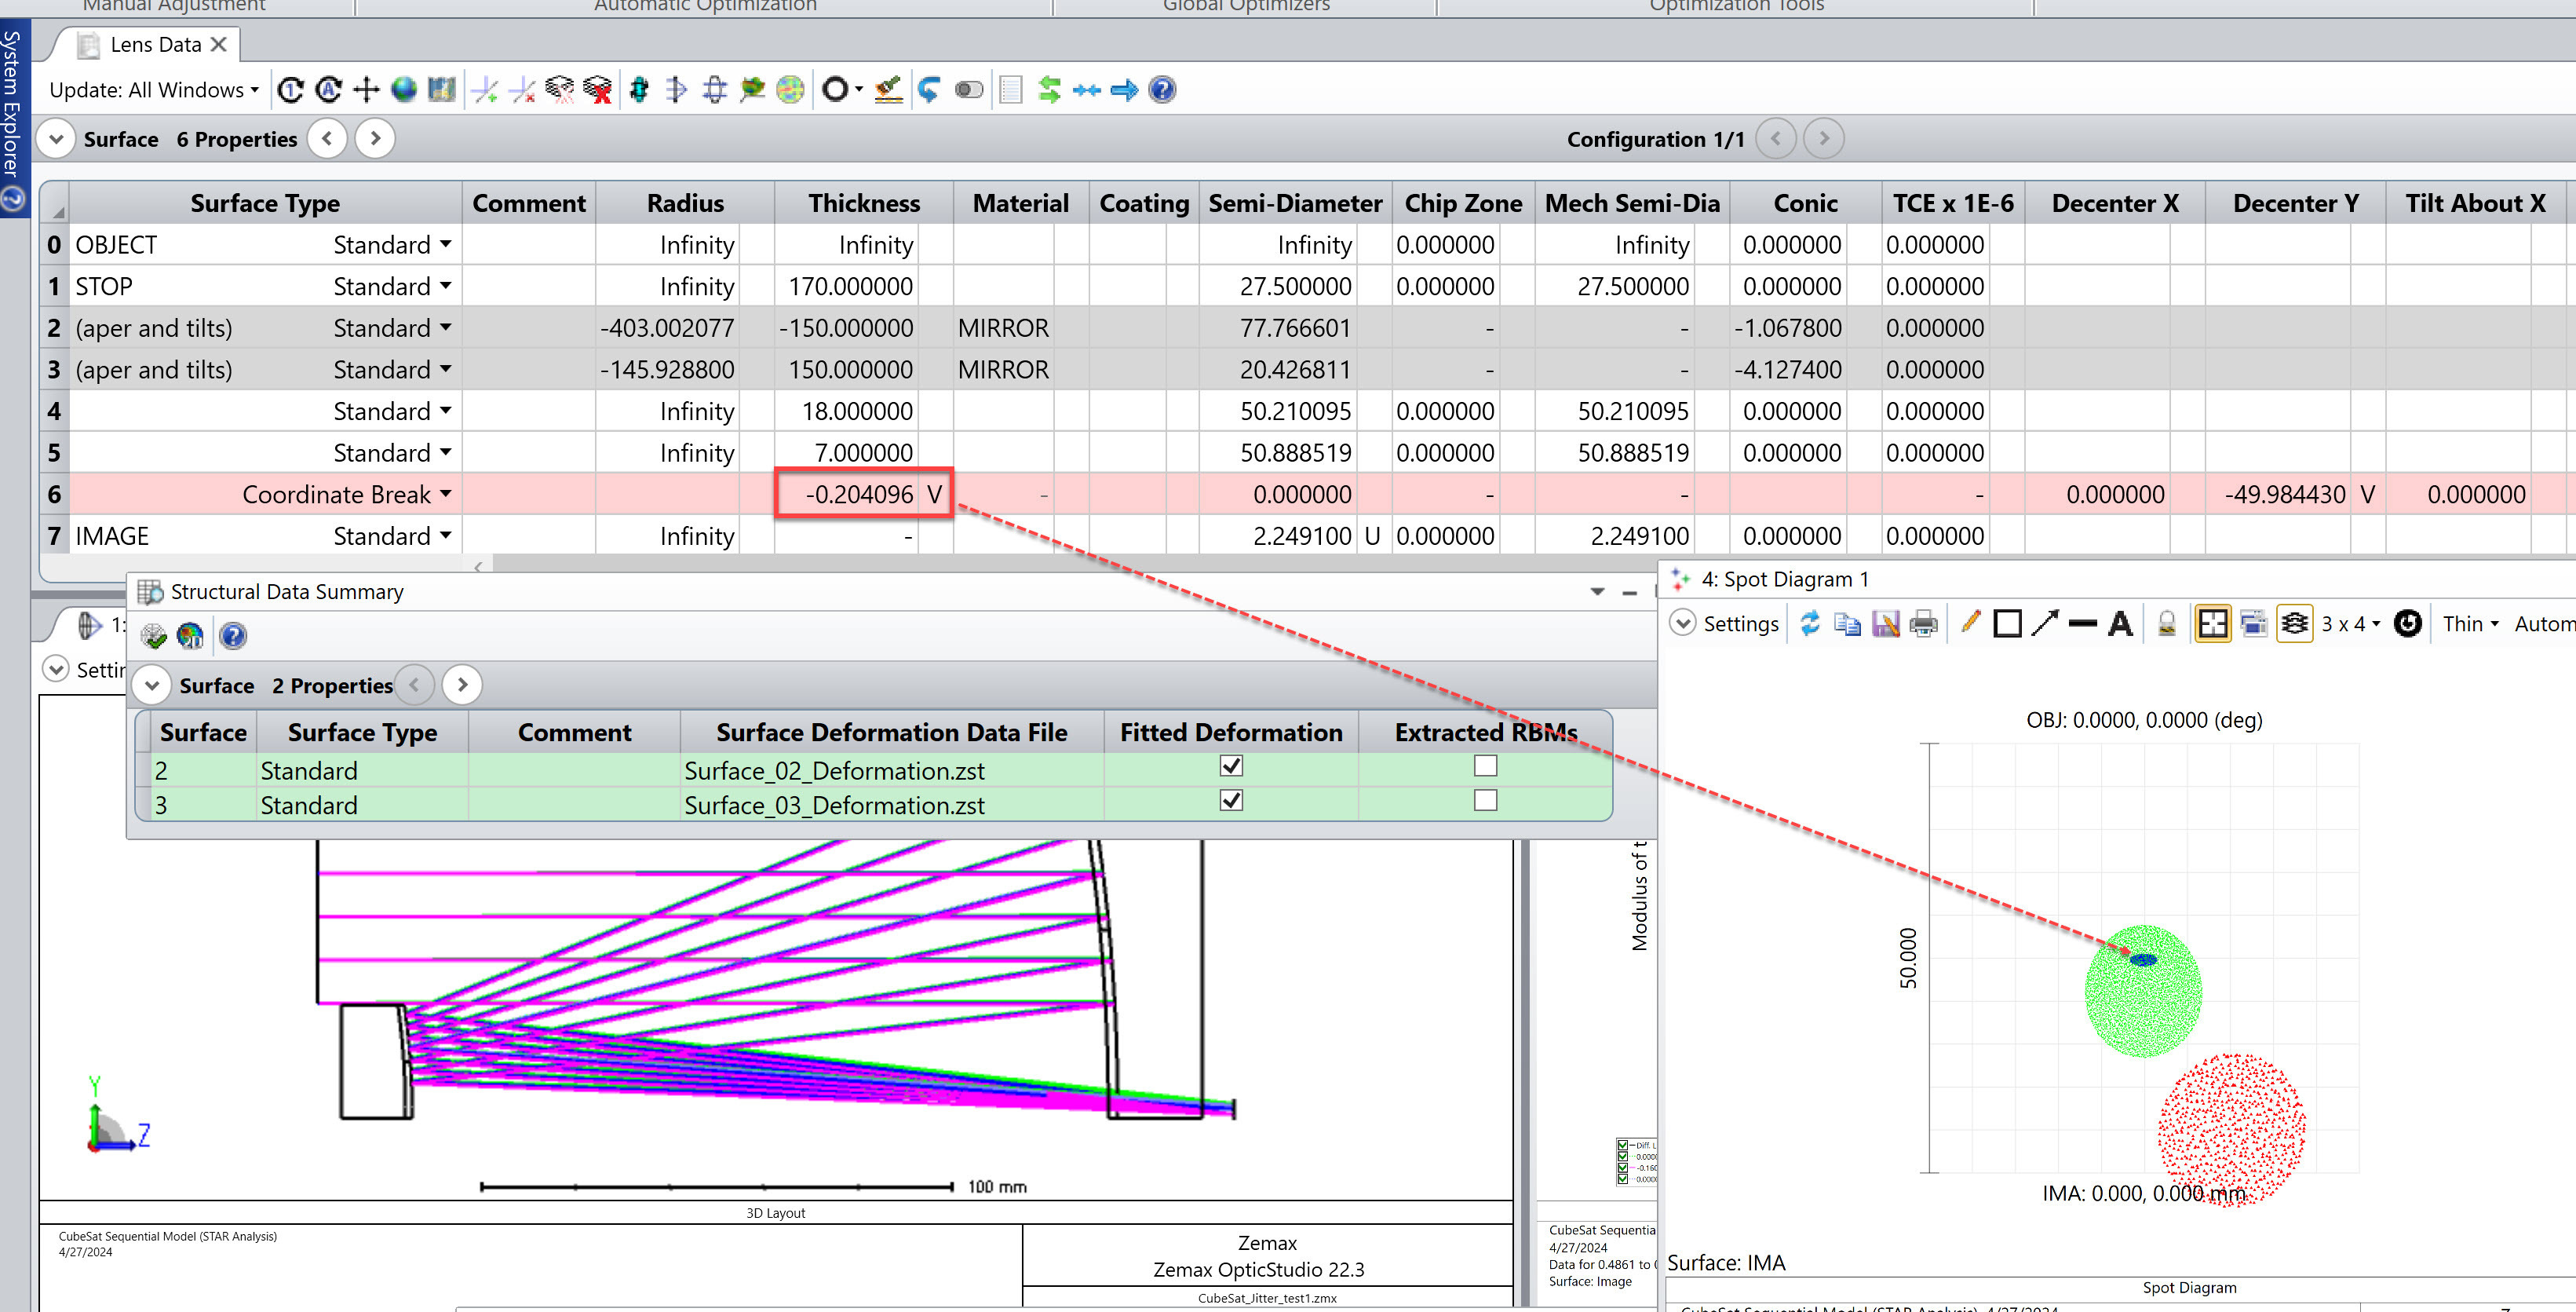
In the STAR tab in OpticStudio, we can now load up the structural dataset under different operating temperatures. The image center can be represented using the centroid position of the on-axis field. We have designed the nominal system at 21C to have its centroid position centered on the sensor array. One can use operand CENX and CENY to report the centroid movement as a function of temperature. Below is an example where the 12C structural deformation FEA data has been loaded onto the primary mirror surface 2 and secondary mirror surface 3. At this operating temperature the image centroid has shifted 10.3 um in the +X direction and 19.9 um in the -Y direction. This creates a 22.4 um radial shift of the image center.
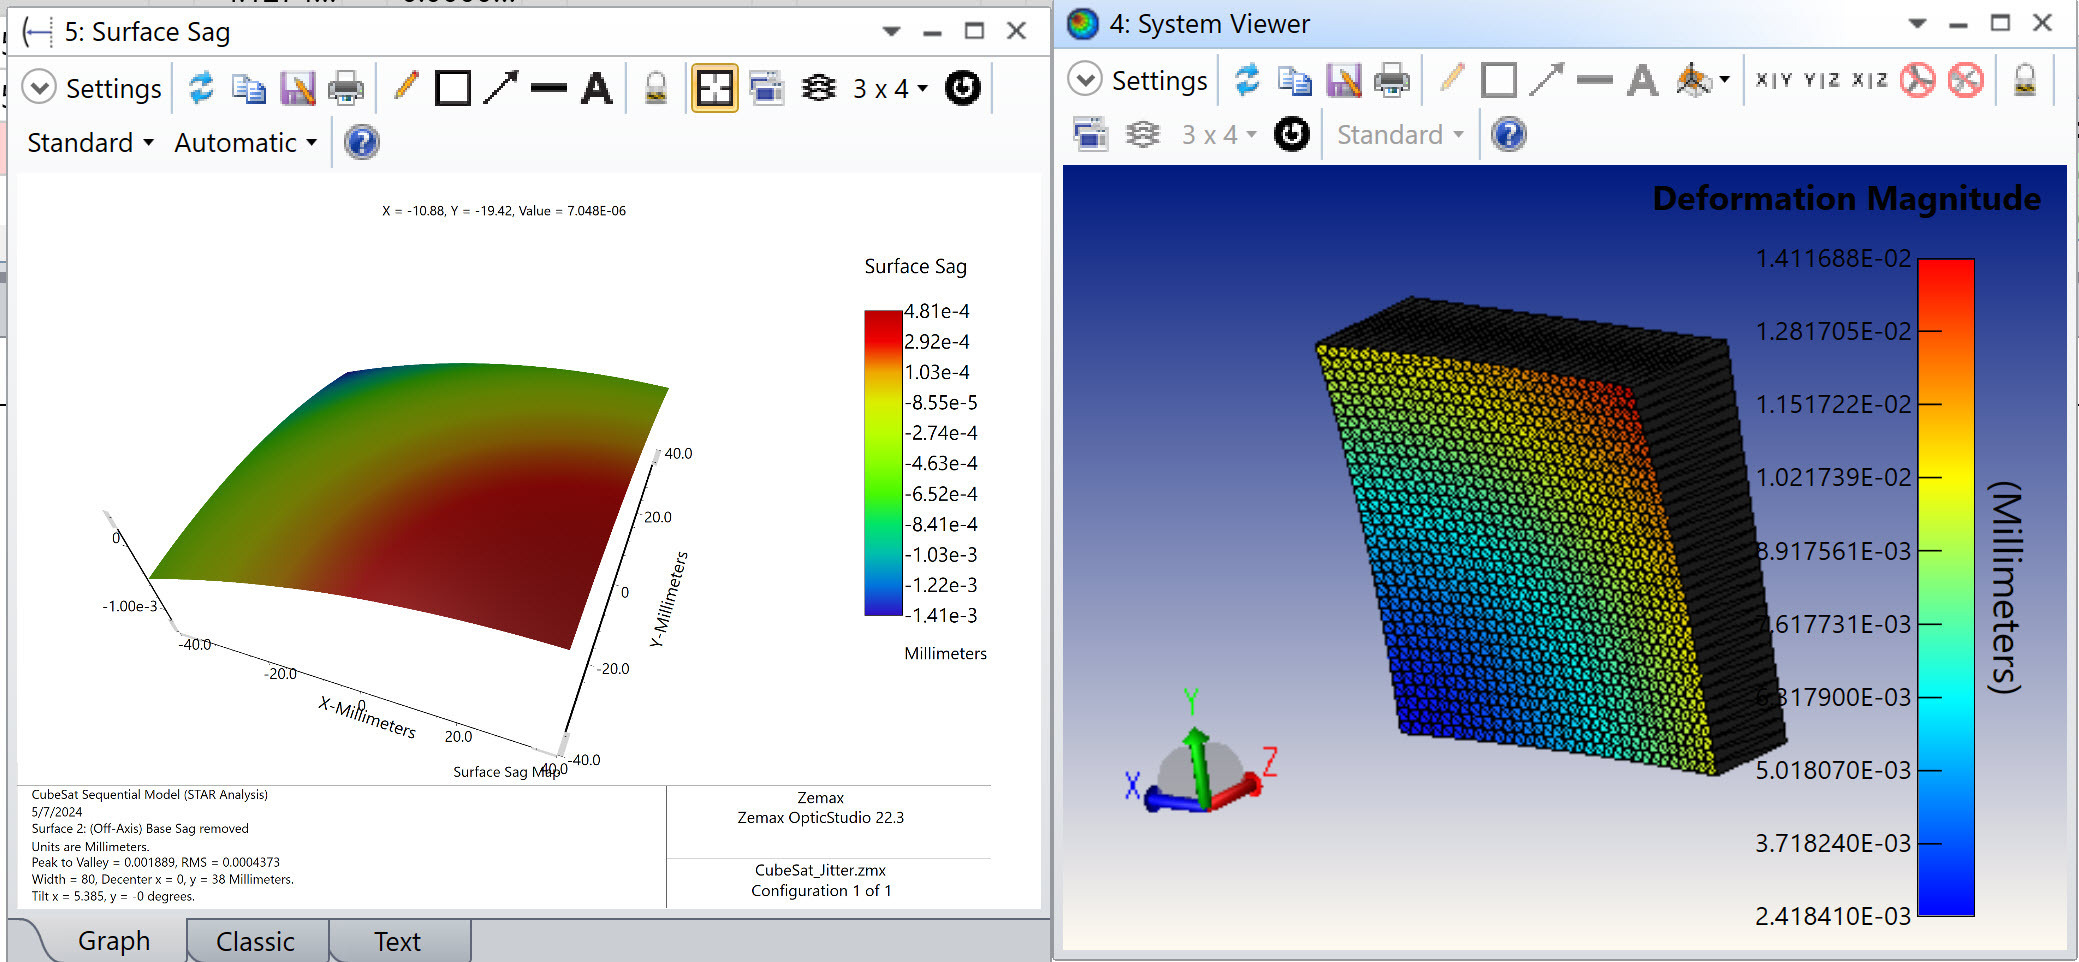
In addition, we can check the sag profile of the two off-axis mirrors. In the Surface/Sag analysis, if we choose “Remove Base Sag” and select “Off-Axis Coordinates” for primary mirror surface 2, we observe following sag deformation due to thermal contraction going from 21C to 12C operating temperature.
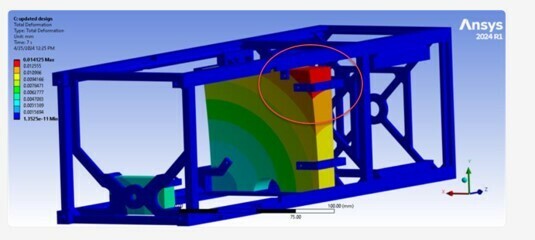
If we compare this with the deformation plot seen in Ansys Mechanical under 12C temperature condition, you will see they match well.
In STAR GUI, we can load this sequence of structural dataset one at a time, ray tracing through the system, and report the image centroid position at different temperatures. The table below summarizes the results.
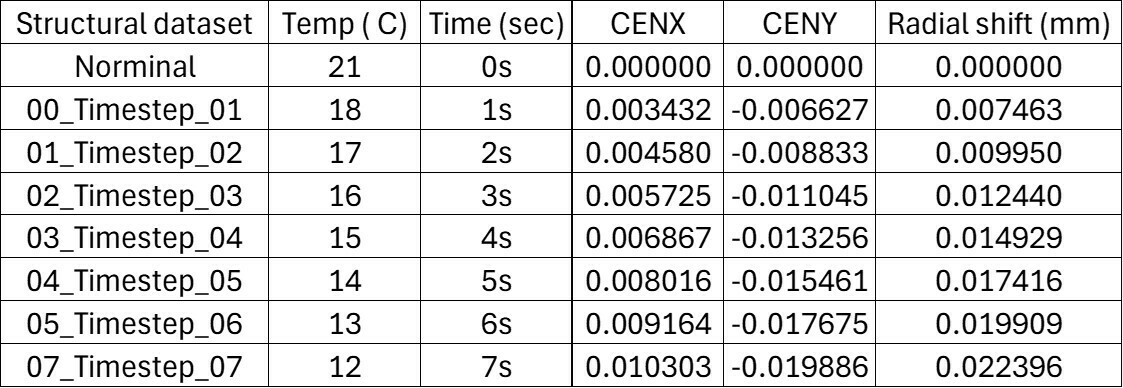
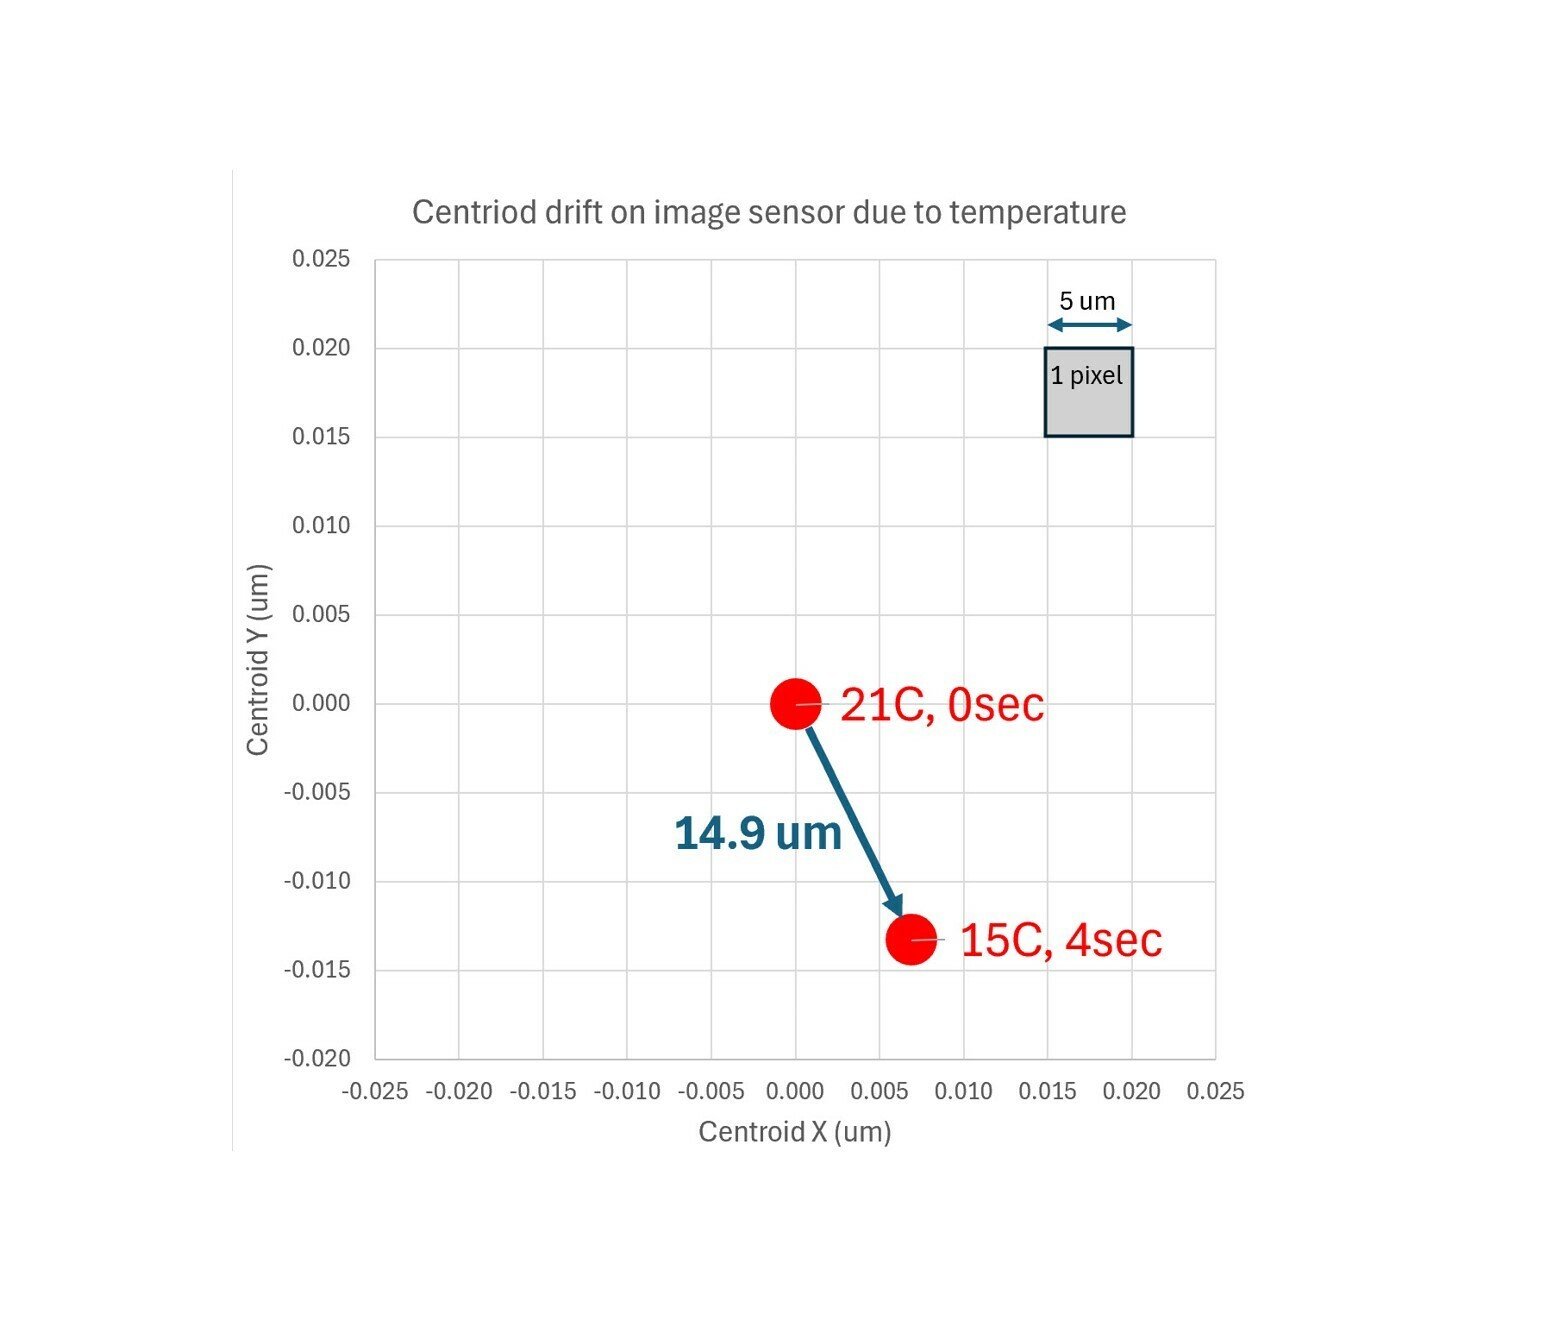
At 15C, which is the center of the operating temperature range in orbit, the image center drifted 14.9 um away from where the expected image center is in nominal system at 21C.
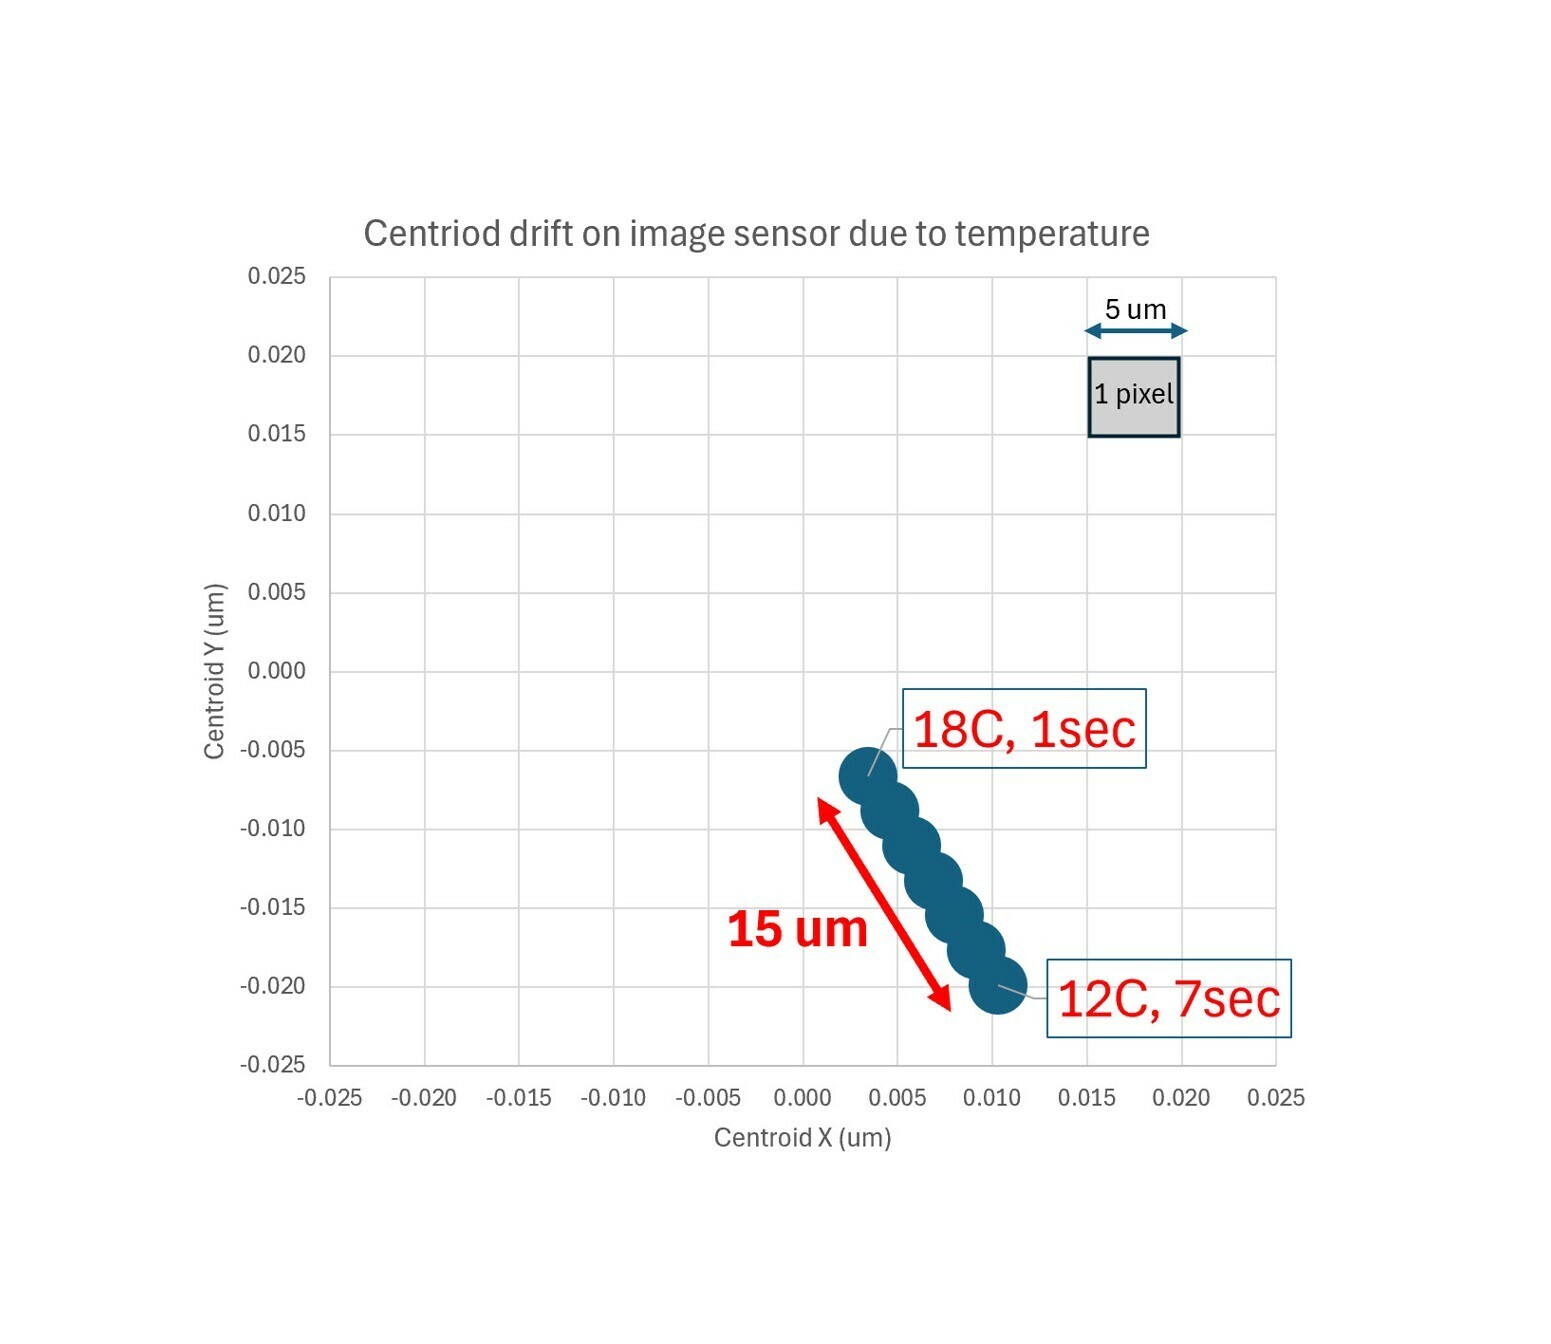
Considering the in-orbit operating temperature range of 15C +/- 3C, we observe an image drift of 15um in a diagonal direction on the image sensor array between the two extreme temperatures 18C and 12C. If we assume a sensor pixel pitch of 5um, this 15um image drift may be significant enough to cause image registration error, and worth looking into.
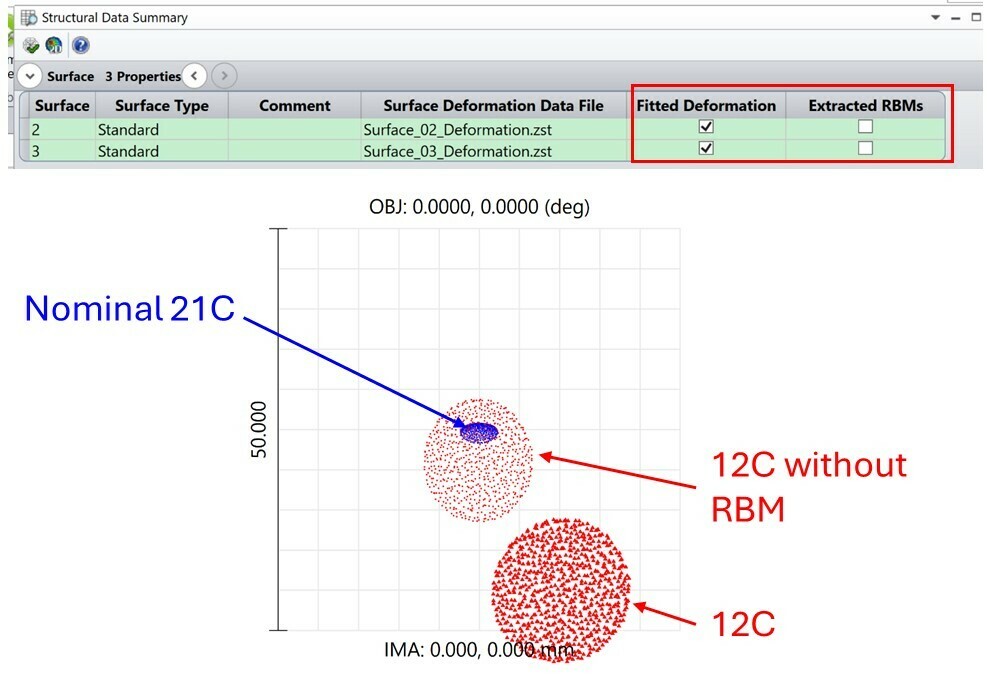
Next, if we compare the image centroid position at 21C nominal design vs at 12C the lowest operating temperature, we observe a 22um drift. STAR provides the option to separate the Rigid Body Motion (RBM) from higher order surface deformation so their impact on performance can be evaluated individually. For the 12C operating temperature, if we remove the RBM motion on primary and secondary mirrors from the structural dataset, we observe the centroid almost moved back to the center of the sensor array, but the spot size remains larger. This suggests that the RBM mainly contributes to the drift of the image, whereas the higher order surface deformation, mainly radius of curvature change due to thermal contraction, causes the beam to be out of focus on the image sensor.
RBMs can be corrected for by establishing a feedback loop to adjust the rotation and translation motion of the mirrors, and the change in the focusing power due to radius change caused by thermal contraction at lower temperature can be compensated by introducing a defocus term to bring the sensor closer to the secondary mirror. After that, the spot position and size almost fully recovered and quite comparable to the nominal system.
To summarize, this article discussed a workflow on how to analyze slow drift of Line-of-sight due to temperature fluctuation in an optical system. Ansys provides a complete Multiphysics product portfolio that supports optical, mechanical, and structural FEA analysis to meet users’ simulation needs. Particularly, Zemax OpticStudio STAR module serves as the interface between the structural and optical software, makes it much easier to bring FEA data back into optical simulation software and enables a streamlined STOP analysis workflow. STAR allows the structural & thermal impacts on optical performance to be analyzed early in the product design cycle so optical designers can spot critical issues early on and deliver better products to market sooner!
This work is done by Ansys Zemax ACE team members, Hui Chen, Julia Zhang, Mojtaba Falahati, and Christophe Weisse.
Special thanks to Jordan Teich, Flurin Herren, and Matthias Schlich who provided optical, mechanical, and structural FEA analysis for this study.
REFERENCES
[1] Genberg, V. L., Doyle, K. B. “Integrated Opto-Mechanical Analysis,” University of Rochester, Summer Short Course 2021
[2] Genberg, V. L., Michels, G. J., Doyle, K. B., “Integrated modeling of jitter MTF due to random loads,” Proc. SPIE 8127, (2011)
