Why and how does the wavefront change by such a large amount (~10x) between the line just before the image plane and the image plane where the line before is at the image plane position and makes no changes (neutral/dummy line).

Solved
Wavefront Change at Image Plane and Just Before Image Plane
Best answer by Jeff.Wilde
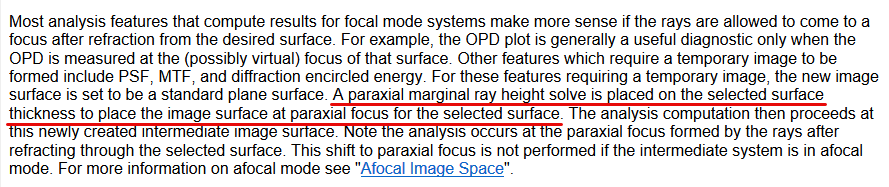
I took a quick look at your model, and it seems that the wavefront error analysis is working as explained in the user documentation. Specifically, as noted above by Michael, when the evaluation surface is not the final image surface, then a paraxial marginal ray solve is applied to the evaluation surface. In the help documentation, see
The Analyze Tab (sequential ui mode) » Image Quality Group » Aberrations (Image Quality Group) » Ray Aberration (Aberrations)
In your case, when this is done, the evaluation surface thickness increases significantly:

Your optical path, which appears to contain Wolter surfaces, is rather complicated, so it’s not surprising that a paraxial ray solve yields this kind of a result.
I’ve simulated Wolter grazing incidence telescopes in the past and have found that a mixed mode model works well, in which the Wolter surfaces are implemented within a non-sequential surface embedded in an otherwise sequential system.
Regards,
Jeff


Enter your E-mail address. We'll send you an e-mail with instructions to reset your password.
Need more help?
To Chinese users:
Do not provide any information or data that is restricted by applicable law, including by the People’s Republic of China’s Cybersecurity and Data Security Laws ( e.g., Important Data, National Core Data, etc.).
不要提供任何受适用法律,包括中华人民共和国的网络安全和数据安全法限制的信息或数据(如重要数据、国家核心数据等)。