Hi Neha,
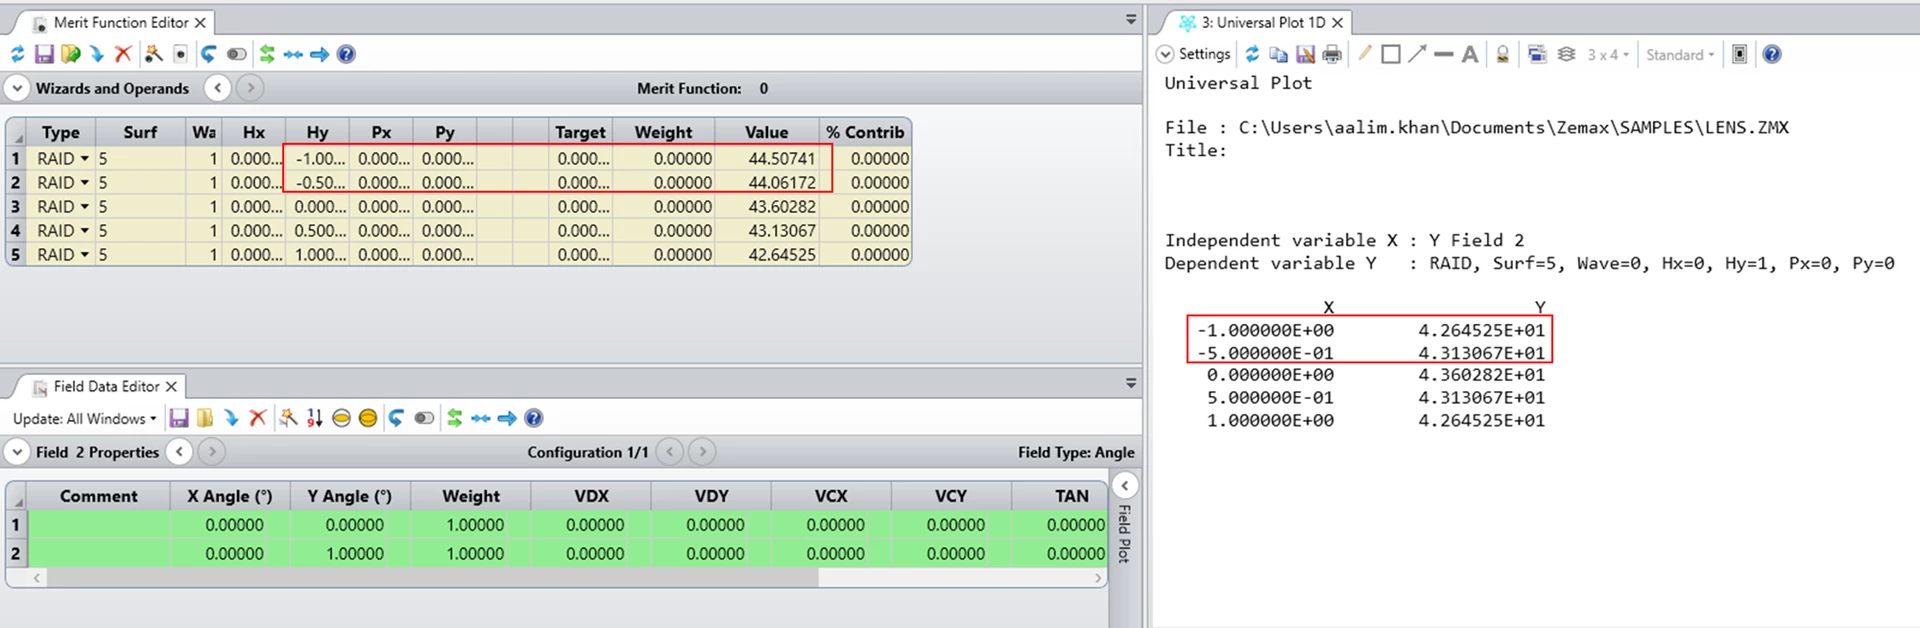
If you look at the Dependent Variable RAID, you can see that you are asking for Hy=1, so you will only get the positive values for the RAID operand. Even when the Y Field 2 is -1.0, that Hy=1 will treat this as a +1.0.
You can see that the Y values are symmetric about 0 and the Y values for -0.5 & -1.0 match 0.5 & 1.0. Since the RAID operand at Surface 5 is non-symmetric, you will have to use 2 Universal Plots, one that has Hy=-1.0 and Y Field ranging from -1.0 to 0 & a second one that Hy=+1.0 and Y Field ranging from 0 to +1.0.
Another option would be to simply use a ZPL macro to get these values and plot them (if needed). This would allow you to directly get the Hy value for both negative and positive values. There is a sample ZPL macro called PLOT.zpl which shows how to create a line plot. You can also use OPEV and OCOD(“RAID”) to easily get the Angle of Incidence in the ZPL.