Solved

Universal Plot 1-D with NSDD not working as expected

  • February 12, 2025
  • 2 replies
  • 69 views

rkarra7

Hi! 

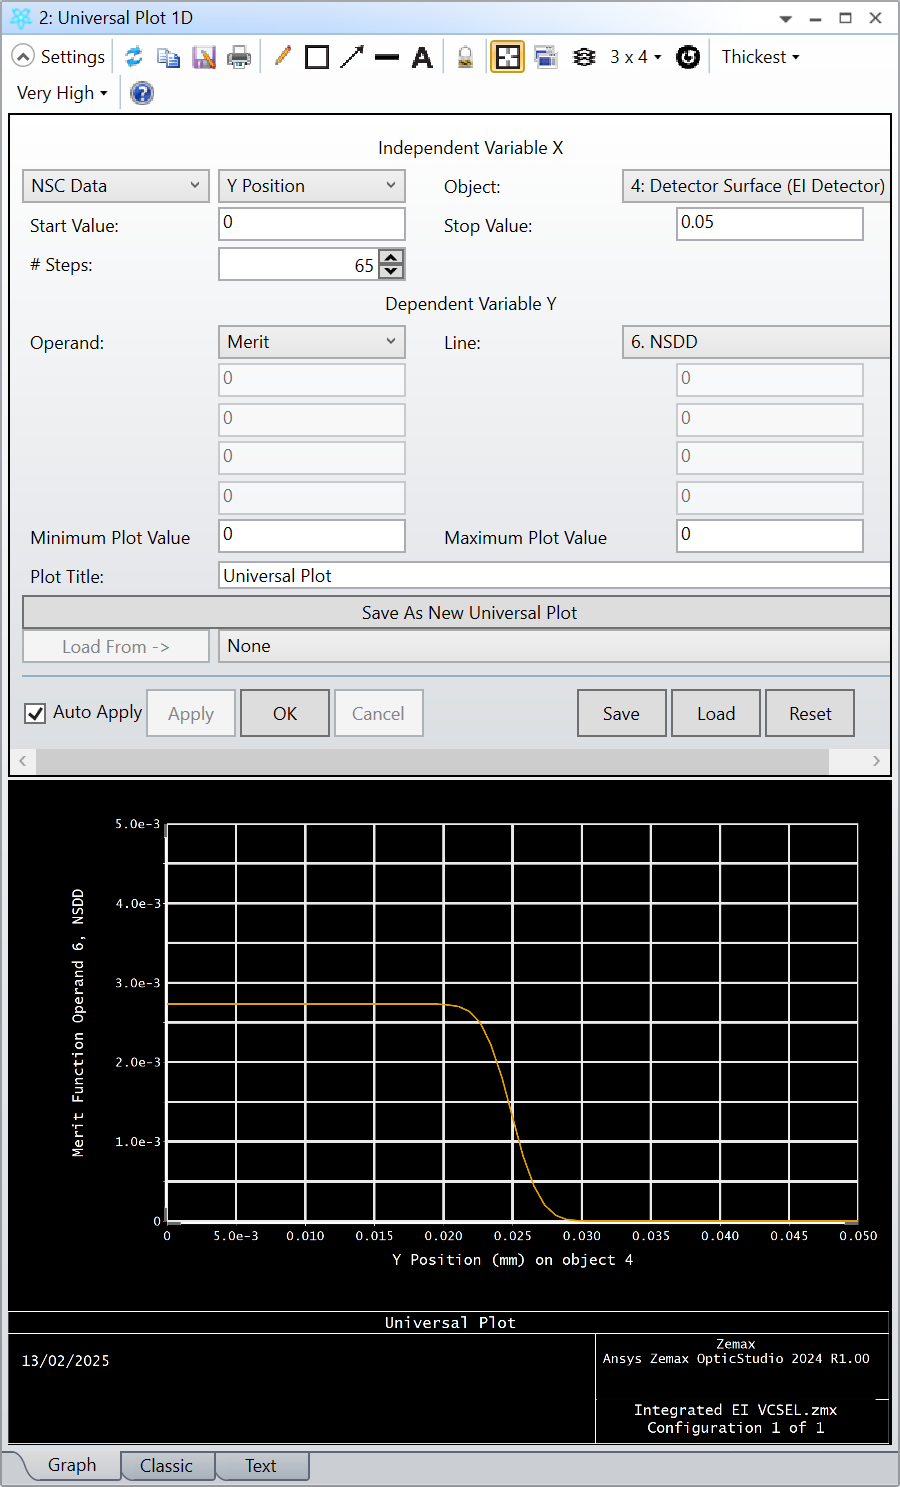
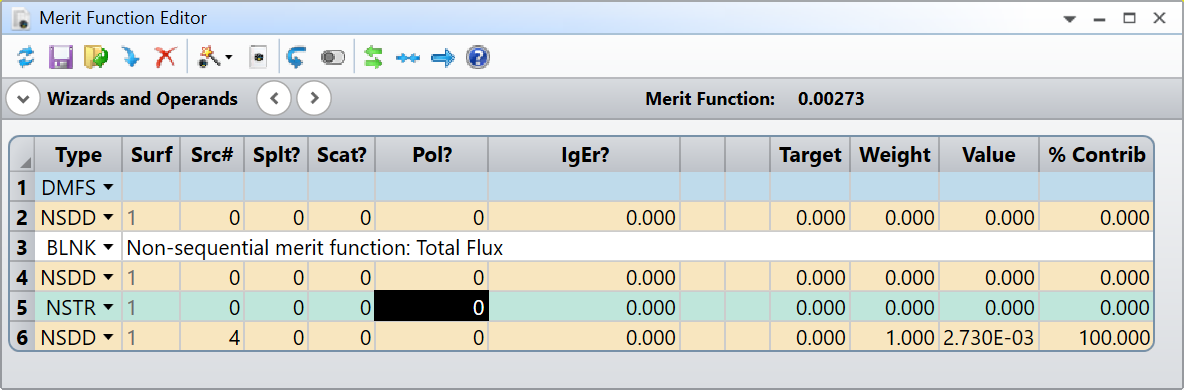
I have a simulation in non-sequential mode, and my goal is to measure the power on a detector using NSDD, and plot the power as a function of y-position using Universal Plot 1-D and NSDD. I think I have defined the system merit function correctly, but every time I plot it, I get a flat line in my plot. 

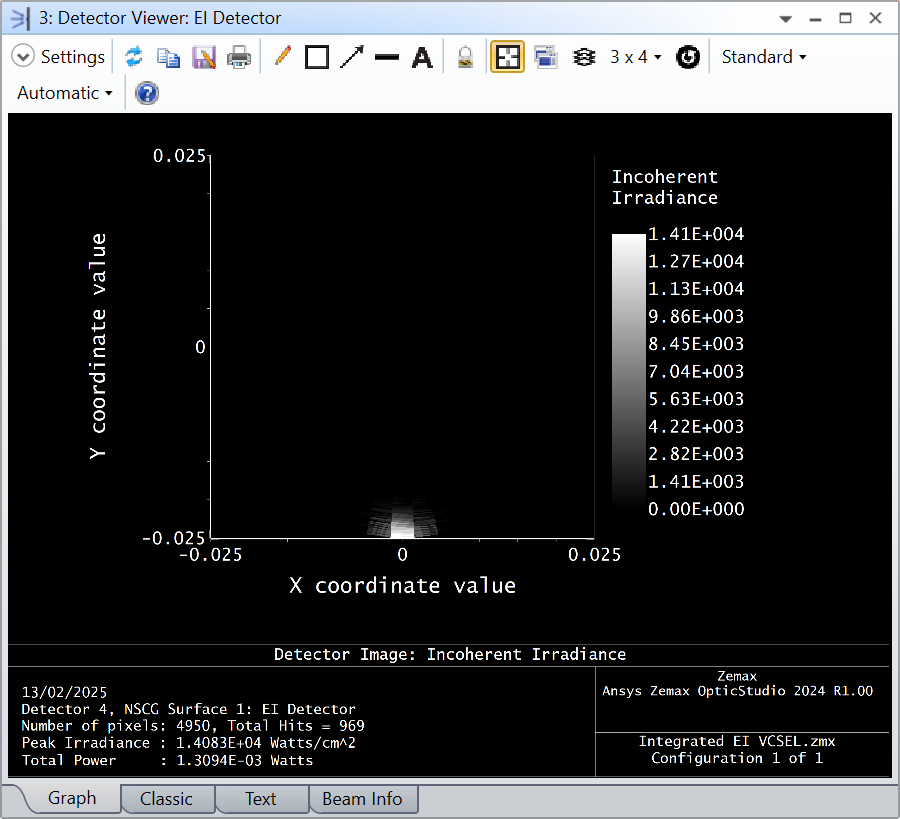
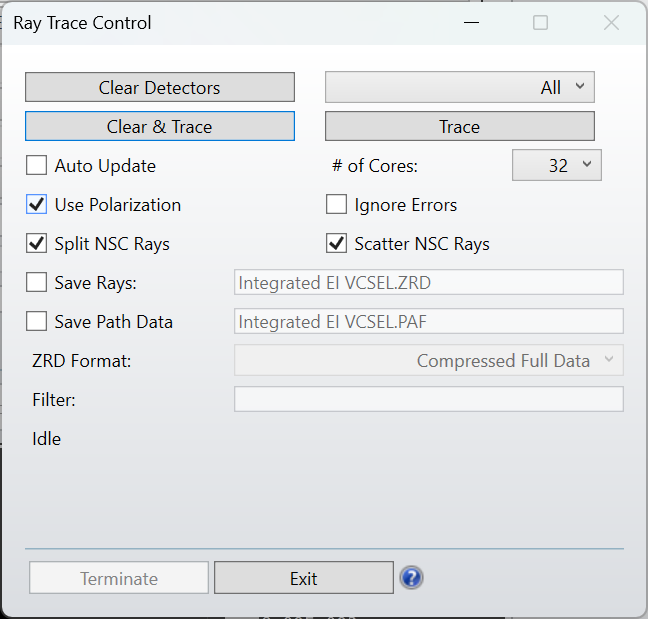
This is not the behavior I expect at all. I have tried manually changing the y-position , conducting a new ray trace, and reading the power on the detector using Detector Viewer. This method causes the power on the detector to change with position, but for some reason the Universal Plot does not show the same results. 

As a sanity check, I have experimented by varying the z-position using Universal Plot 1-D and NSDD instead, and I am able to see a relationship in my plot. However, another thing that is very curious is that the values in the plot are not consistent with the power on the Detector Viewer -- they are off by an order of magnitude! 


To summarize

  1. I am not able to get my desired plot working using NSDD and Universal Plot 1-D. My plots show no variation of total power on the detector with the y-position of the detector, even though I know this is not true (manually tested). What am I doing wrong? 
  2. Does the “Total Power” at the bottom of the Detector Viewer measure something different than NSDD with the parameters I used? If so, how do I measure total power properly using NSDD?

I am using the following parameters in NSDD. 

Det #: 4 (my detector is object 4 in NSCE) 

Pix #: 0 

Data: 0 

# Ignored: 0 

I have attached a .zip file of my simulation, as well as images to illustrate what I’m talking about. 

The detector viewer screenshot I attached says total power is 3.994E-5 Watts, but on my plot, the @ z-position = 0.005, the NSDD value is 0. 

Best answer by David.Nguyen

@rkarra7 


TL;DR Perhaps you can try changing the Pol? column of NSTR to 1 in the Merit Function and see if it makes a difference?


If you want to make it easier to reproduce your issue, you should share a ZAR file instead of ZMX. The ZAR file will contain all the necessary files to run the ZMX file. Currently, the coatings are missing when we download your file. To create a ZAR file, press File..Create Archive. That being said, it might not be a problem.

Your file was a bit confusing, there were some values in the Y and Z positions of Object 4, and the detector was therefore quite out of the way. I did the following tests with Y = 0 and Z = 5E-3 for Object 4.

I’ve setup a 1-D plot with a Y Position from 0 to 0.05 and got this:

This makes sense, the detector collects all the light at Y Position = 0, this is a power of 2.73E-3 as specified in the Power(Watts) column. Then, as the Y Position increases, it reaches a point where the detector gets out of the ray pencil and the power starts to drop. The detector has a Maximum Aperture of 0.025mm, which is exactly where the power gets halved. Seems to also make sense to me. If I run a raytrace at Y Position = 0.025 (Z Position is still 5E-3), I get the following Detector Viewer:

With a total power of 1.3094E-3 Watts, which is again expected.

Since everything seem to be ok on my end, it brings me back to the coatings and what I said about ZMX files. When you do your raytrace and detector analysis do you use Polarization (Use Polarization: checked)?

Because in your Merit Function, the Pol? flag is OFF (value is 0):

This would explain why you have different results with your coatings (depending on your coatings, which we don’t have since you only share the ZMX file). Perhaps you can try changing the Pol? column of NSTR to 1 in the Merit Function and see if it makes a difference?

Take care,


David

View original
Did this topic help you find an answer to your question?

2 replies

David.Nguyen
Luminary
Forum|alt.badge.img+2
  • Luminary
  • 1085 replies
  • Answer
  • February 13, 2025

@rkarra7 


TL;DR Perhaps you can try changing the Pol? column of NSTR to 1 in the Merit Function and see if it makes a difference?


If you want to make it easier to reproduce your issue, you should share a ZAR file instead of ZMX. The ZAR file will contain all the necessary files to run the ZMX file. Currently, the coatings are missing when we download your file. To create a ZAR file, press File..Create Archive. That being said, it might not be a problem.

Your file was a bit confusing, there were some values in the Y and Z positions of Object 4, and the detector was therefore quite out of the way. I did the following tests with Y = 0 and Z = 5E-3 for Object 4.

I’ve setup a 1-D plot with a Y Position from 0 to 0.05 and got this:

This makes sense, the detector collects all the light at Y Position = 0, this is a power of 2.73E-3 as specified in the Power(Watts) column. Then, as the Y Position increases, it reaches a point where the detector gets out of the ray pencil and the power starts to drop. The detector has a Maximum Aperture of 0.025mm, which is exactly where the power gets halved. Seems to also make sense to me. If I run a raytrace at Y Position = 0.025 (Z Position is still 5E-3), I get the following Detector Viewer:

With a total power of 1.3094E-3 Watts, which is again expected.

Since everything seem to be ok on my end, it brings me back to the coatings and what I said about ZMX files. When you do your raytrace and detector analysis do you use Polarization (Use Polarization: checked)?

Because in your Merit Function, the Pol? flag is OFF (value is 0):

This would explain why you have different results with your coatings (depending on your coatings, which we don’t have since you only share the ZMX file). Perhaps you can try changing the Pol? column of NSTR to 1 in the Merit Function and see if it makes a difference?

Take care,


David


rkarra7
  • Author
  • Monochrome
  • 2 replies
  • February 13, 2025

@David.Nguyen I did not know I had to upload the ZAR file! Will keep in mind for next time. 

Sorry for being unclear. The detector was in the correct position. I did not want the detector directly in front of the source -- I was trying to have a y-offset because I was trying to measure the power from reflections of the surfaces I defined. 


Nonetheless, your answer was very helpful. My NSTR was inconsistent with my Ray Trace Controls. I was Ray Tracing with Polarization, Split and Scattering on, but my NSTR function did not have any of them on. I am now getting the plot I expected. 

Thank you so much! 


Reply


Cookie policy

We use cookies to enhance and personalize your experience. If you accept you agree to our full cookie policy. Learn more about our cookies.

 
Cookie settings