Currently running OpticStudio 20.2 Professional. Trying to use the Tolerance data visualization functions (Histogram and Yield) for the first time, but they are grayed out and non-functional. The tolerance data viewer is working and displays the results data set. I have run a short Monte-Carlo set and saved the files. How to I engage the Histogram and Yield functions?

Solved
Tolerance data visualization - Histogram and Yield icons grayed out and non-functional
Best answer by Allie
Hi Michael,
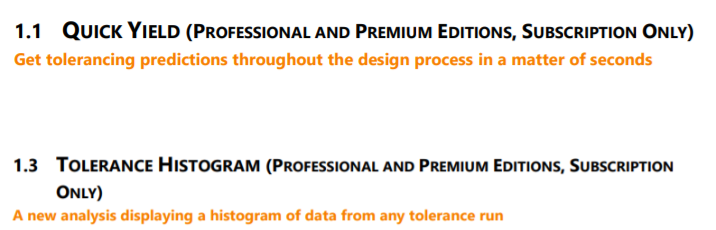
The Quick Yield and Histogram features are only available for Premium or Profession Subscription-type licenses. This is outlined in the Release Notes for 20.2:
Are you using a Perpetual-type license with OpticStudio? If so, these features will not be available. If you're not sure which license type you have, you can follow the instructions in the article 'How to identify your OpticStudio license' to locate that information. In the updated License Manager (postdated June 2019) a subscription license will be shown in boldface font within the 'View License Information' tab for softkeys or red USB keys. If you have a black USB key, then it is a Perpetual-type license.
If you don't hold a Subscription license but are interested in these features, let us know, and we can put you in touch with you account manager to discuss how to get you access!
Best,
Allie


Reply
Enter your E-mail address. We'll send you an e-mail with instructions to reset your password.
Need more help?
To Chinese users:
Do not provide any information or data that is restricted by applicable law, including by the People’s Republic of China’s Cybersecurity and Data Security Laws ( e.g., Important Data, National Core Data, etc.).
不要提供任何受适用法律,包括中华人民共和国的网络安全和数据安全法限制的信息或数据(如重要数据、国家核心数据等)。