


Image Simulation simulates the formation of images by convolving a source bitmap file with an array of Point Spread Functions. The effects considered include diffraction, aberrations, distortion, relative illumination, image orientation, and polarization.
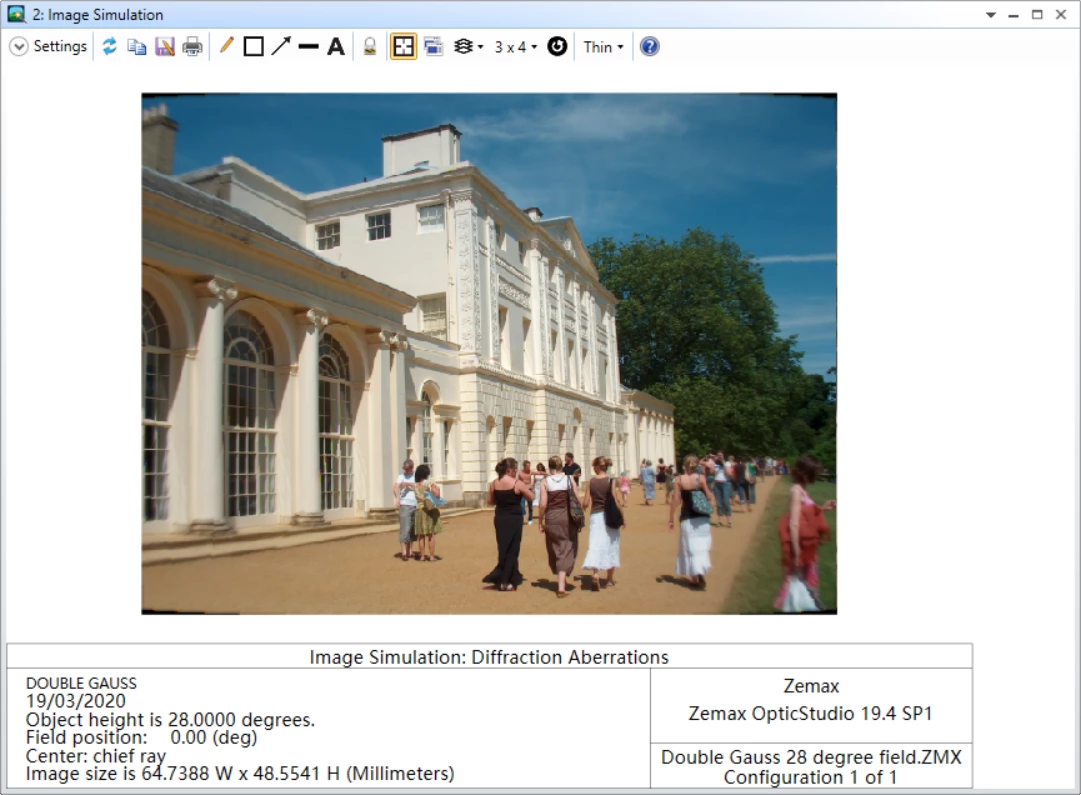
We can observe the real color picture formed by this feature quickly, it is convenient for system work in visible range of wavelength. However, how does Image Simulation Combine those colors? We use wavelengths set in System Explorer and color channels in Image Simulation.
For the Wavelength setting in Image Simulation: If “RGB” is selected, then 3 wavelengths will be defined, 0.606, 0.535. and 0.465 micrometers for red green, and blue, respectively; no matter what the current wavelength definitions are. If “1+2+3” is selected, then wavelengths 1, 2, and 3 as currently defined on the wavelength data box will be used. The red channel of the source bitmap will be used for wavelength 3, green channel for wavelength 2, and the blue channel for wavelength 1. The displayed image will be in RGB format no matter what wavelengths are defined using this option. For selection of a specific single wavelength, such as 6, the B channel image will be used for wavelengths 4, 7, 10, 13, etc. The G channel image will be used for wavelengths 5, 8, 11, 14, etc. The R channel image will be used for wavelengths 6, 9, 12, 15, etc.
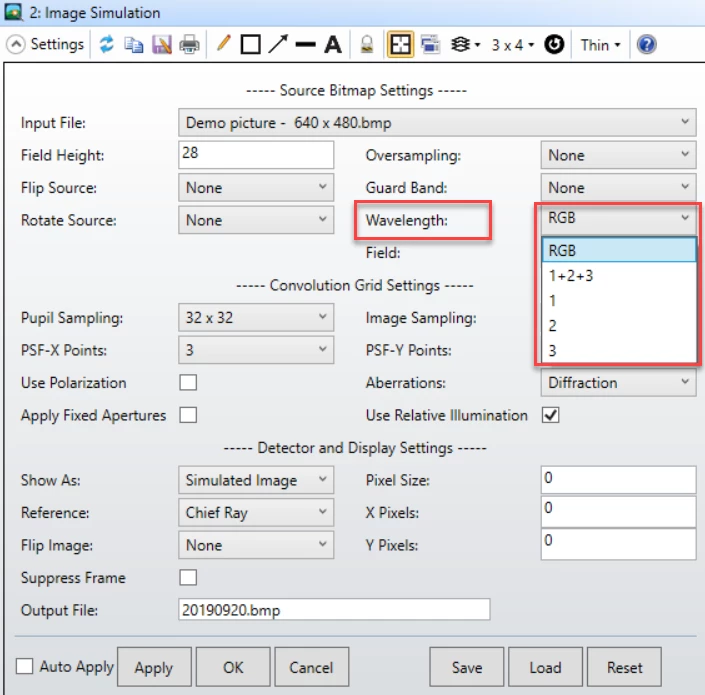
By using this method, you can display monochrom graphic result even your system is work in infrared.