Solved

Sensitivity Analysis of a NSC System

  • 27 January 2022
  • 8 replies
  • 240 views

Badge

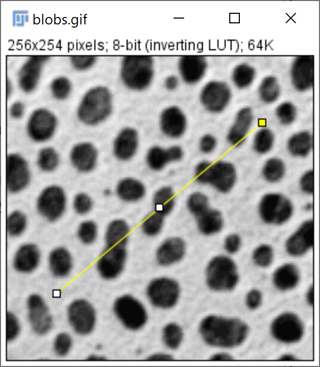
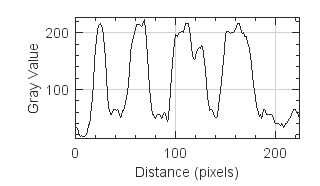
For the sake of better understanding the impact of individual components I played with tilts and decenters of lenses imaging a diode array in the far field. One of the criteria was the far field divergence i.e. a rather precise cross-section profile at a certain distance. Due to tilts and/or decenters the image of the diode array on the (stationary) detector moves up and down. As such the image (footprint of the array) provides a certain degree of information (see attached) but it is impossible to apply e.g. the “Cross section row” feature in order to obtain a precise profile shape or get the correct numerical values thereof. This feature obviously works correctly only if the image lies on the X-axis of a detector. It is of course, possible to shift the detector in Y direction to place the (shifted) image on X-axis but it would be difficult to hit the precise Y-shift value.
Is it possible to add a “self-center” feature to “Cross section row” (or column) for such cases? Any other ideas/ suggestions?
Regards, Dusan

icon

Best answer by Jeff.Wilde 27 January 2022, 19:52

View original

8 replies

Userlevel 7
Badge +2

Hi Dusan,


In the settings of a Detector Viewer, there’s a field called Row/Column that you can use to select a different row or column when you use Show as: Cross Section Row.

Now if you want to automate the selection of the row, you need to come up with an algorithm to do so. Perhaps you could look at the intensity averaged over the columns and pick the row where it is maximum. With the ZOS-API you could change the setting of the Detector Viewer for that particular row using the field mentioned above, or translate the detector to center it on the row of interest. The problem that I see is people are going to want different algorithms to find the best row, and it’ll be hard to implement a one-size-fits-all solution. If you can save your detector data and share it with us, we can help you write a small ZOS-API snippet to try and find the row you want. 

Have I understood your question correctly and does that make sense?

Take care,


David

Badge

Hi David

Thank you for the feedback. I guess it would be difficult to select the right row or column i.e. it would require several trials...

I agree that it is almost impossible to generate a one-size-fits-all algorithm but what about that: a cursor that appears on the detector surface as soon as Cross Section Row or Column have been selected? The user would place the cursor at the desired location and get a cross section through that point? Placement wouldn’t be perfectly precise but probably good enough.

Best regards, Dusan 

Userlevel 7
Badge +2

Hi Dusan,


This makes total sense to me, but I’m affraid I can’t help you more with that. These kind of features have to come from the dev team I guess.

Take care,


David

Badge

Hi David

Thank you again for your readiness to help. Let’s see if this idea flies…

Best regards, Dusan

Userlevel 7
Badge +3

Hi Dusan,

I don’t think it is particularly difficult to accomplish what you would like to do.  First, there already exists a cursor function on the analysis windows, including the Detector Viewer window.  It shows you the (x,y) coordinates, as well as the value of displayed data set, at the position of the cursor.  So, if you have some irradiance distribution, say displayed on a Detector Rectangle, then you can simply move the cursor by eye to the centroid of this distribution and read off the (x,y) coordinates.

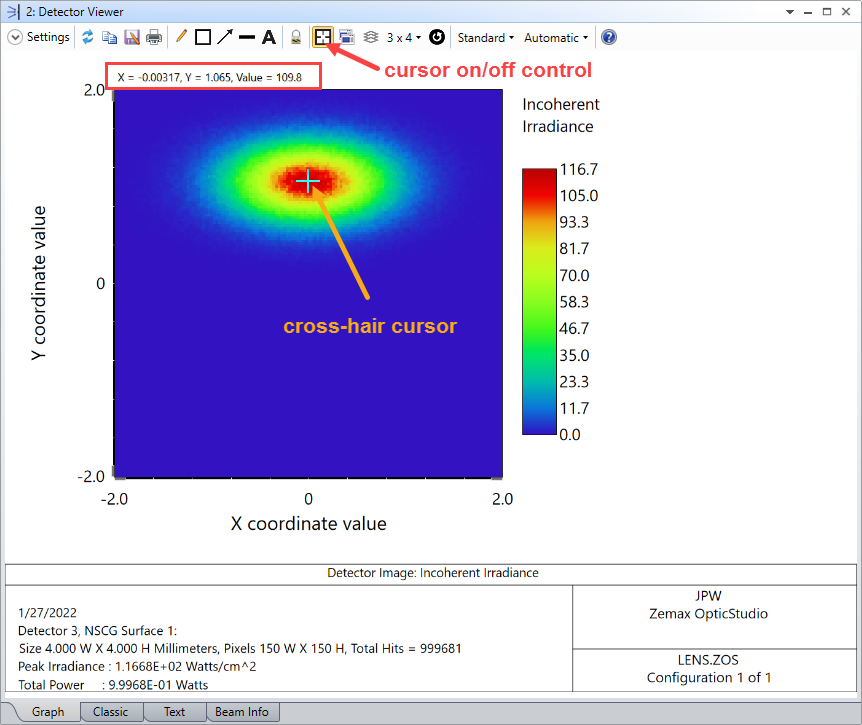
In this example, the cursor shows (x,y) = (-0.003 mm, 1.065 mm). 


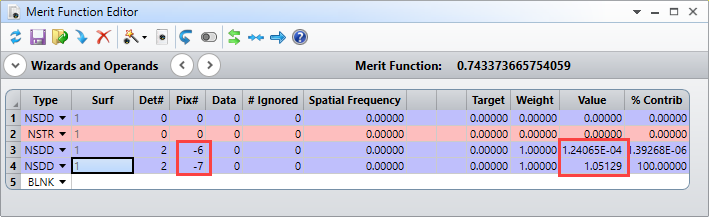
For a more quantitative approach, you can numerically compute the centroid using the NSDD merit function operand:


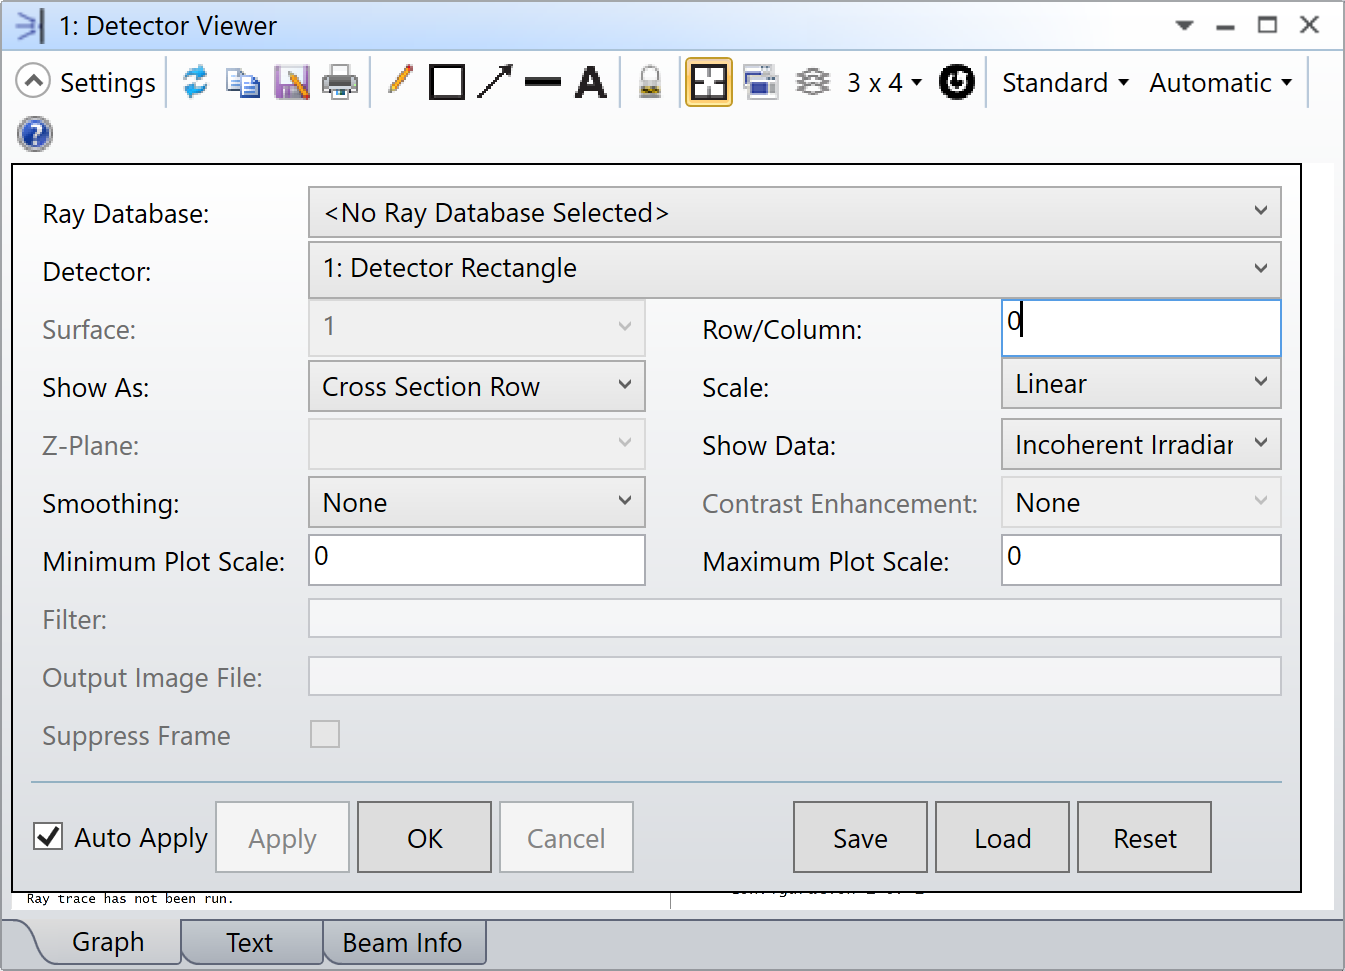
To center the irradiance distribution on the detector, you can simply shift the position of the detector (as you have already noted) and then plot the cross-section along the center row and/or center column.


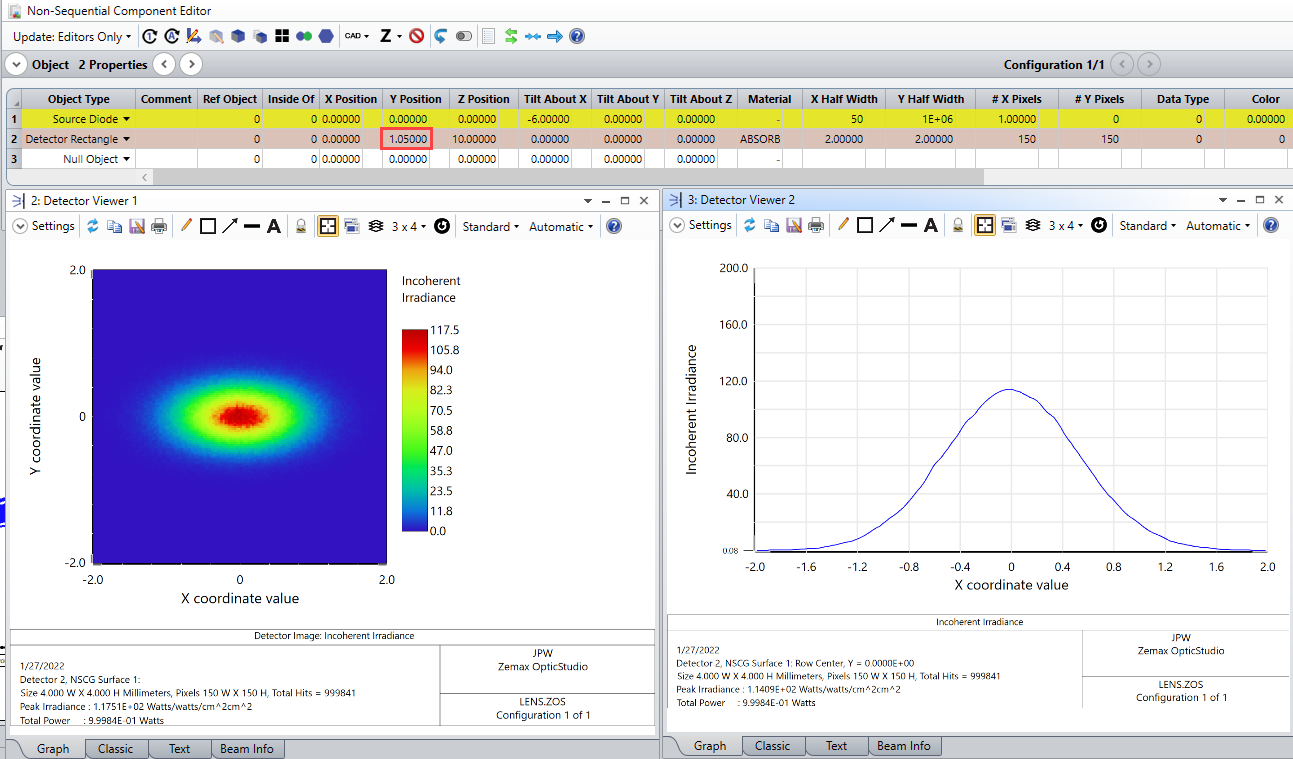
Isn’t this what you are looking to accomplish?

Regards,

Jeff


Badge

Hi Jeff

Thank you for this elegant and precise approach. You are right, the cursor is already there. However, for many successive calculations of this type, resulting in varying hot-spot positions it would save time if the cross-section plot would appear automatically after manual placement of the cursor. I agree: precision wouldn’t be that good but a good indicator that we are moving in the right direction…

Regards, Dusan

Userlevel 7
Badge +3

Sure, I understand what you are suggesting.  Matlab, for example, has an “improfile” function that produces cross-sectional plots along user-drawn (or programmatically specified) line segments.  I think there are a variety of improvements that could be made to the graphics in OpticStudio (e.g., the annotation features), but it’s just a matter of priorities -- should development time be spent on better graphics, or say on new features more directly related to optical design. Of course as users we would like to see it all… :grinning:


Userlevel 7
Badge +2

I don’t know if it makes sense, but you could also have an automatic solution to save all the Detector Viewer images, and use a third-party program to view cross-sections in the different images. A bit unrelated, but ImageJ has nice image analysis features in this regard. You can draw a line in your image:

And by pressing Ctrl+K (on Windows) you get a profile along that line, which you can export to a CSV file:

You can even press a button (called Live) in the line plot figure and then it keeps track of the profile as you move the line around. You can also open several images and synchronize them before you draw the exact same line-profile in all of them.

In the end, I think @Jeff.Wilde has a good point about development priorities and as much as we want to see it all. Sometimes, it might be easier to combine different programs which have different strengths for your analysis.

Take care,


David

Reply