Hi,
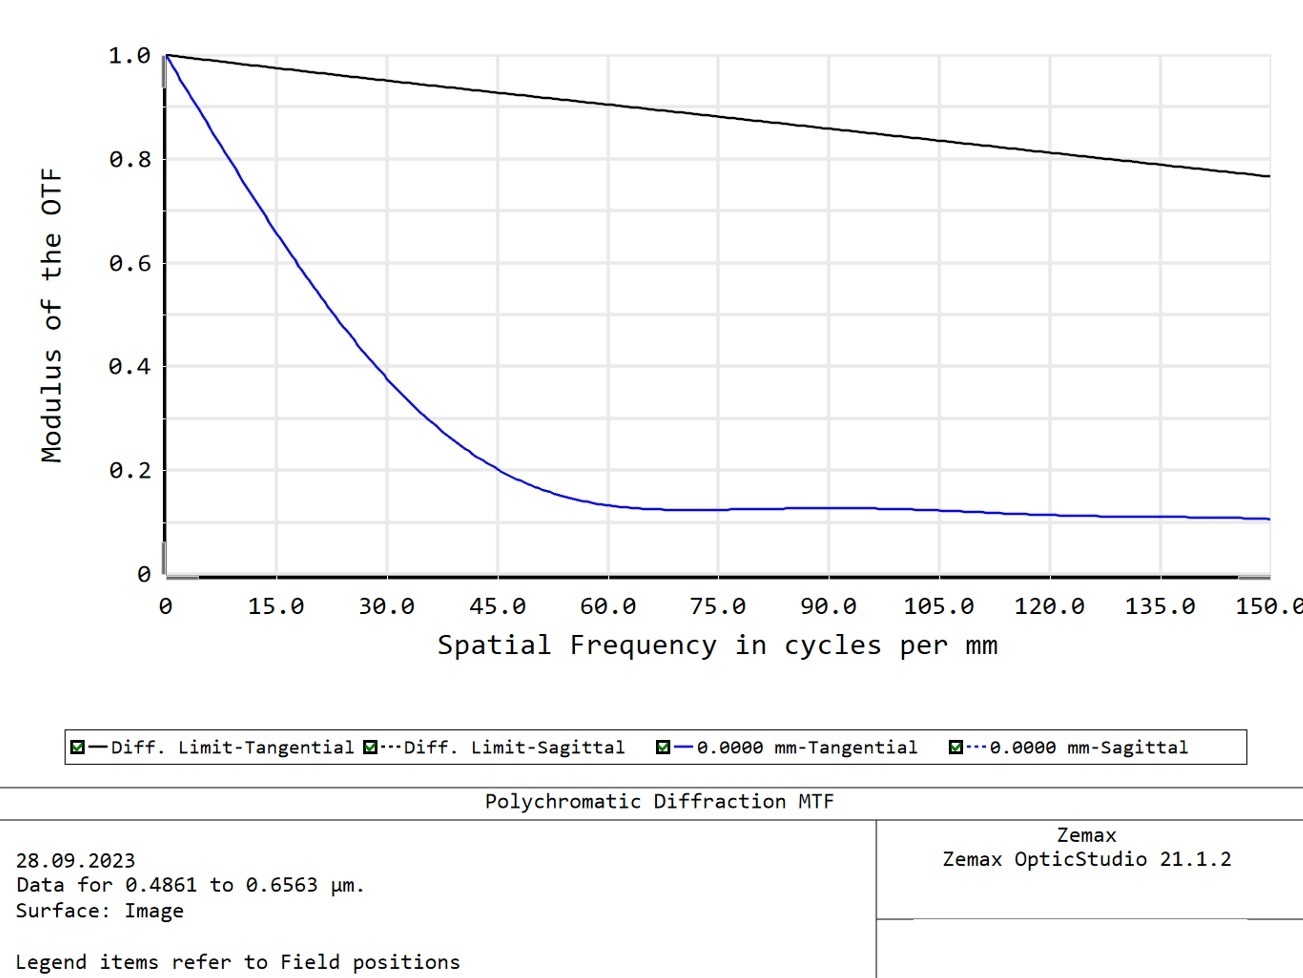
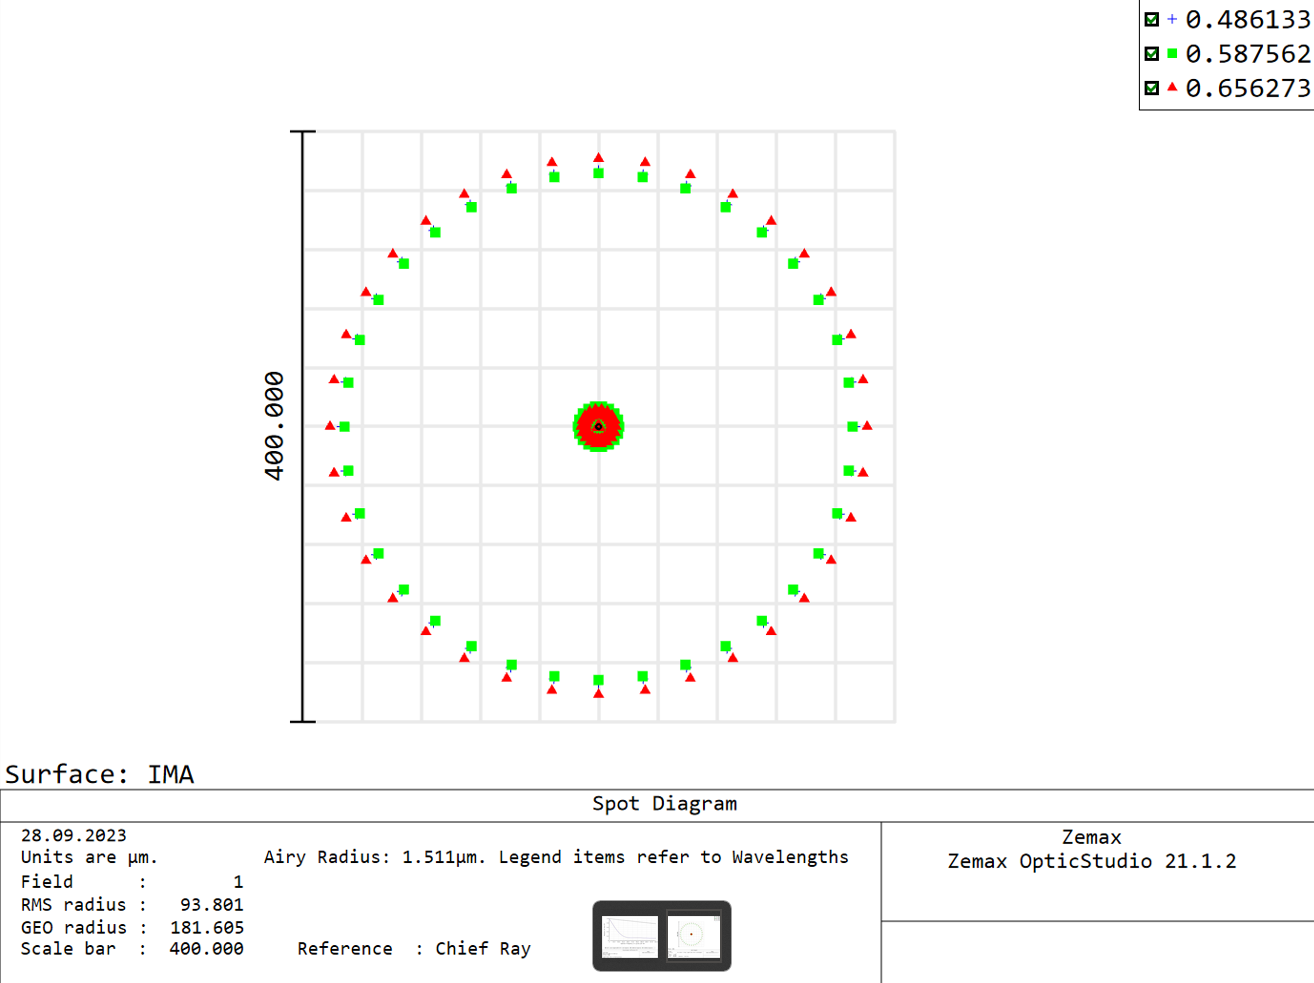
There are two analysis output of one imaging design below. My question is that how can be FFT MTF values so higher during the RMS and geometric spot size radius are high.

Hi,
There are two analysis output of one imaging design below. My question is that how can be FFT MTF values so higher during the RMS and geometric spot size radius are high.
Best answer by Mike.Jones
What is your wavelength weighting? Spot diagrams are geometric, not diffraction-based, and aren't a good measure of system performance when comparing them to diffraction-based analysis like MTF and EE. You appear to have high SA for rays near the pupul rim, and that can make spots appear much larger. Post up a ray fan plot. I'm guessing it will show relatively low ray spreading across most of the aperture, then large whiptails near the pupil rim. The ray aberrations would be larger, but there's not much energy out there. Trust diffraction MTF and EE more than spots.
Enter your E-mail address. We'll send you an e-mail with instructions to reset your password.
Do not provide any information or data that is restricted by applicable law, including by the People’s Republic of China’s Cybersecurity and Data Security Laws ( e.g., Important Data, National Core Data, etc.).
不要提供任何受适用法律,包括中华人民共和国的网络安全和数据安全法限制的信息或数据(如重要数据、国家核心数据等)。
