Is there a method to visualize in the 3D layout specific segments of a ray trace path in NS mode?
I have performed a ray trace in NS and saved the rays and path data. For some of the paths I need to visualize specific segments, not from the source, but after an iteration with a surface.
Is that possible?
Best answer by MichaelH
Hi Daniel,
Right now, there is no way to “filter” the NSC ray trace to only show rays between specific objects. A Filter String applies logic to a specific segment but then the entire ray is displayed on a layout plot.
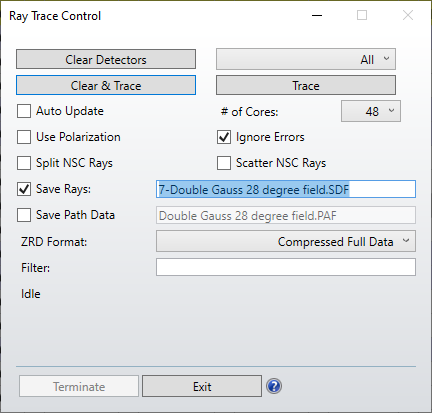
If you only want to view the ray segments between 2 objects, you can save the rays from the first object as an SDF file and turn the face of the second object to ABSORB. To save the SDF file, you can specific the Object Number along with an SDF format when you run a ray trace; the following screenshot would create a SDF source file from the second element of the Double Gauss (from sequential samples & running the NSC Converter):
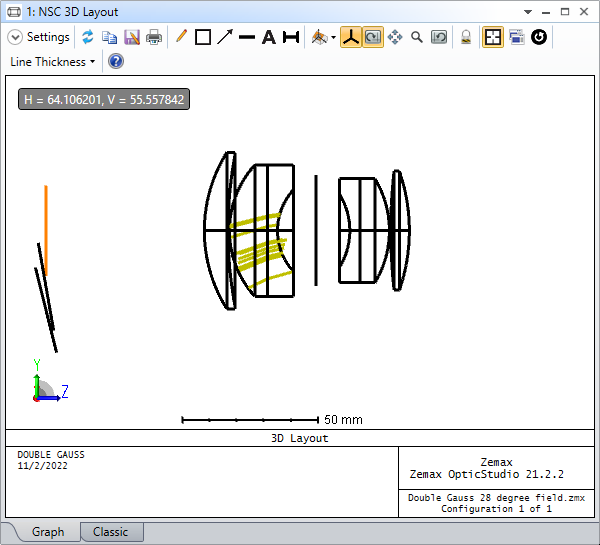
Then if I want to only view this through the doublet, I would set both Face 0 and Face 2 of Object 8 to ABSORB. I would get the following 3D Layout:
If you want to achieve this without manually modifying the NCE, the only way to achieve what you want is to create your own custom ZRD parser and save a new ZRD file. Once you apply the logic you want about which segments, you will need to consider the following:
Each new set of segments must be treated as a new ray (i.e., only continuous segments per ray) If you have objects A-B-C-D-E-F (A is the source) and you want to display segments between both B-C and D-E, this would have to be saved as 2 individual rays.
Each new ray has to have their level value modified so it starts at 0. So the objects from B & D would have level 0 and C & E would have level 1.
The storage and nx values for level 0 need to be changed to reflect the wavenumber (int) and wavelength in microns (double). So if the system is monochromatic at 0.55um, then the storage for B & D would be 1 and the nx for B & D would be 0.55.
You can either use the ZOS-API with the IZRDReader or you can manually parse the ZRD file if it’s saved in the UFD format. The Help File has the data structure for a ray database file under The ZRD Uncompressed Full Data Format (UFD) section.
Right now, there is no way to “filter” the NSC ray trace to only show rays between specific objects. A Filter String applies logic to a specific segment but then the entire ray is displayed on a layout plot.
If you only want to view the ray segments between 2 objects, you can save the rays from the first object as an SDF file and turn the face of the second object to ABSORB. To save the SDF file, you can specific the Object Number along with an SDF format when you run a ray trace; the following screenshot would create a SDF source file from the second element of the Double Gauss (from sequential samples & running the NSC Converter):
Then if I want to only view this through the doublet, I would set both Face 0 and Face 2 of Object 8 to ABSORB. I would get the following 3D Layout:
If you want to achieve this without manually modifying the NCE, the only way to achieve what you want is to create your own custom ZRD parser and save a new ZRD file. Once you apply the logic you want about which segments, you will need to consider the following:
Each new set of segments must be treated as a new ray (i.e., only continuous segments per ray) If you have objects A-B-C-D-E-F (A is the source) and you want to display segments between both B-C and D-E, this would have to be saved as 2 individual rays.
Each new ray has to have their level value modified so it starts at 0. So the objects from B & D would have level 0 and C & E would have level 1.
The storage and nx values for level 0 need to be changed to reflect the wavenumber (int) and wavelength in microns (double). So if the system is monochromatic at 0.55um, then the storage for B & D would be 1 and the nx for B & D would be 0.55.
You can either use the ZOS-API with the IZRDReader or you can manually parse the ZRD file if it’s saved in the UFD format. The Help File has the data structure for a ray database file under The ZRD Uncompressed Full Data Format (UFD) section.
I was also looking for this functionality recently. Good to know I wasn’t missing something obvious, but it would be nice to incorporate an easier approach with the filter string.