Question

Plotting ray incidence angles

  • 21 June 2024
  • 9 replies
  • 217 views

Hi everyone,

I'm looking for a way to plot ray incidence angles for a given surface. While RAID allows this for individual rays, I'm interested in a plot, similar to the ‘Incident Angle vs. Image Height’ plot, but applicable to an arbitrary surface.

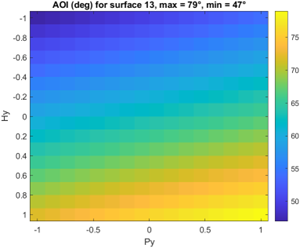
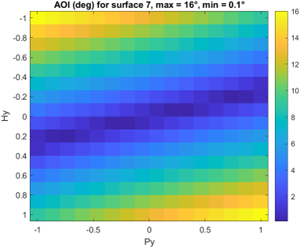
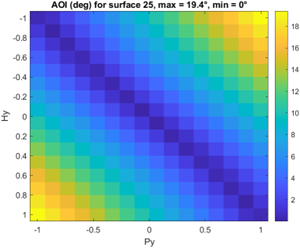
Ideally, it would be a 2D plot that shows the incidence angle over field and pupil coordinates. I've explored using the universal plot, but it doesn't seem straightforward since you can't vary the Hy, Py inputs to the merit function directly.

I realize this can be achieved with a custom script, and I’m hoping someone might already have a solution or be willing to share something that accomplishes this.

Thanks in advance for any help!

9 replies

Userlevel 7
Badge +2

Sorry didn’t read the question well and cannot delete my post...

Userlevel 7
Badge +2

I started looking at this and made the following rough code based on RAID:

https://github.com/Omnistic/zosapi_aoi_on_surface_analysis

Its obviously not complete, and there might be errors in my code, but I hope someone else can also contribute to making such a tool. So far, this is what the code gives:

Looking forward to see what comes out of this topic 😊

Take care,


David

Userlevel 7
Badge +3

Hey John,

A bit rough-and-ready, but have you tried the Spot diagram, setting the surface you want (1) and choosing ‘Show Direction Cosines’ (2)?


Userlevel 3
Badge

Hi @Mark.Nicholson 

Yes, this helps. But it looks like the direction cosines don’t measure the angle of incidence, which I’m after to see angles the coating design needs to accommodate.


Userlevel 3
Badge

@David.Nguyen ,

Very cool, this looks like what I’m after. I’ll take a look at your code. Thanks!

Userlevel 3
Badge

Hello David,


I’ve implemented a simpler version of your code in Matlab for plane symmetric systems, which only varies the Y direction of pupil and image coordinates. The script returns the AOI array in memory to compute statistics. Note that RAID always returns a positive number.

Change .txt to .m for the attached.

Below are a few examples. The visualizations are helpful, for me at least…

This result for a mirror in the system: 


Here is the result for a powered surface:


Image surface:


Userlevel 7
Badge +2

Excellent @John.Hygelund,


Out of curiosity, what do you take away from such figures? Would you mind elaborating a bit?

Take care,


David

Userlevel 3
Badge

Hi @David.Nguyen,

Consideration for coatings. I have the angle dependence of the coating, but it wasn’t clear how to “see” which surfaces were pushing the limits…Looking at the pupil and field angles provides some more information on how the design performs and could be optimized to improve.

This is a new area for me, so if there is a better way to do it, I’m all ears! 

Thanks,

John

Userlevel 7
Badge +2

I see, so if you see that the coating performance drops above a certain angle of incidence, you can then look which surfaces display such angles of incidence. Makes sense. I guess you could also adjust the color bar to highlight those regions of interest where the angle of incidence is above a certain threshold. Would it make sense to know the direction of the angle of incidence as well? I’m thinking about a quiver plot maybe.

I have no experience in that area myself, but I’m curious about other people’s applications always 😋

Take care,


David


Reply