Hopefully a simple question here. Is there anyway Zemax can auto output distances (thickness) between optics in a layout? I have a multi-lens setup and need to provide separations between each of them in a report, and creating a text box every time through the 3D Layout window is tedious. Appreciate the help!
Best,
Michael
Best answer by MichaelH
Hi Michael,
This is a non-trivial task, namely because if you want to automate this, you need to make sure that both the calculations are correct and the “look" of the text you add to the plot is correct (indicator lines are in the correct location, labels don't overlap, etc). There are a few considerations and limitations you need to consider:
You have to use the 3D Layout and not the 2d Layout. The 3D Layout uses global coordinates for annotations while the Layout uses “window” units, meaning the values for LINE and TEXT would change based on the current zoom position.
For complete control, you should use LINE3D and TEXT3D (this would allow you to place things like Comment, Radius, or Material on the plot as well. For this simple example of air spaces, we will use MEASURE3D which is slightly easier to implement.
Since we're only looking at air spaces, you need to consider when you “enter” a cemented element (doublet, triplet, etc) and when you “exit” the element. You cannot simply cycle through the LDE and look at the elements with something in the Material column.
This becomes much more difficult when you’re using off-axis, freeform, or folded systems since you need to calculate the placement of the lines/text in 3D space rather than just 2D space.
Since the annotations places the text on a defined plane, you need to know which Camera View Projection you're using. This script uses the YZ plane.
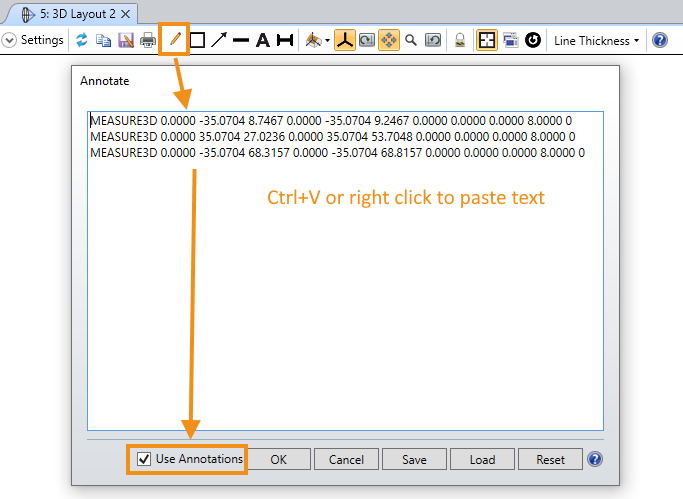
With all those caveats, the attached ZPL will calculate the air space gaps between all elements and then will place the annotation text on the Windows clipboard. After you run the script, simply open the Edit Annotation window, paste the text and click the Use Annotations checkbox:
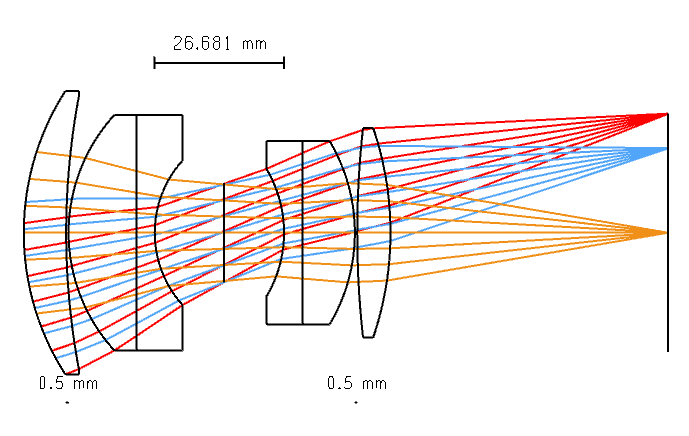
For the Double Gauss 28 degree field.zmx, the 3D Layout will look like:
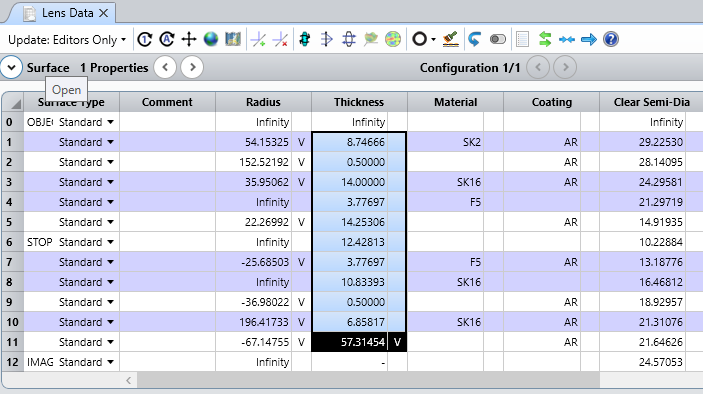
Can’t you just use your mouse to select the thickness cells in the Lens Data Editor and then copy/paste them into whatever output format you like (e.g, Notepad or Excel)?
Maybe I didn’t pose my questions clearly. I need the distance between in each lens to be outputed on the 3D layout image itself. That same output window has options to annotate using the bold “A” symbol which is what I am using write now to manually type in. I’m curious if there’s an easy way to auto include that.
Okay, now I understand. That’s a more challenging problem. There may be a way to do it programmatically, but if so I’m not aware of how. That being said, there are some very good coders on the forum who might be able to chime in.
It would be nice if such a feature were built into the layout plot. That would definitely save time compared to manually adding dimensions (either directly to the layout as you are doing or afterwards in Powerpoint for presentation purposes).
This is a non-trivial task, namely because if you want to automate this, you need to make sure that both the calculations are correct and the “look" of the text you add to the plot is correct (indicator lines are in the correct location, labels don't overlap, etc). There are a few considerations and limitations you need to consider:
You have to use the 3D Layout and not the 2d Layout. The 3D Layout uses global coordinates for annotations while the Layout uses “window” units, meaning the values for LINE and TEXT would change based on the current zoom position.
For complete control, you should use LINE3D and TEXT3D (this would allow you to place things like Comment, Radius, or Material on the plot as well. For this simple example of air spaces, we will use MEASURE3D which is slightly easier to implement.
Since we're only looking at air spaces, you need to consider when you “enter” a cemented element (doublet, triplet, etc) and when you “exit” the element. You cannot simply cycle through the LDE and look at the elements with something in the Material column.
This becomes much more difficult when you’re using off-axis, freeform, or folded systems since you need to calculate the placement of the lines/text in 3D space rather than just 2D space.
Since the annotations places the text on a defined plane, you need to know which Camera View Projection you're using. This script uses the YZ plane.
With all those caveats, the attached ZPL will calculate the air space gaps between all elements and then will place the annotation text on the Windows clipboard. After you run the script, simply open the Edit Annotation window, paste the text and click the Use Annotations checkbox:
For the Double Gauss 28 degree field.zmx, the 3D Layout will look like:
@MichaelH Hi Michael! I was considering moving your ZPL to the Code Exchange (I will leave it accessible for everyone). Let me know if this would be ok for you.
@Sandrine Auriol Sounds good. It would also be great to add a feature request to modify the annotations via the ZOS-API. This could add some really cool & powerful markups with very little effort from the developers.