Hello,

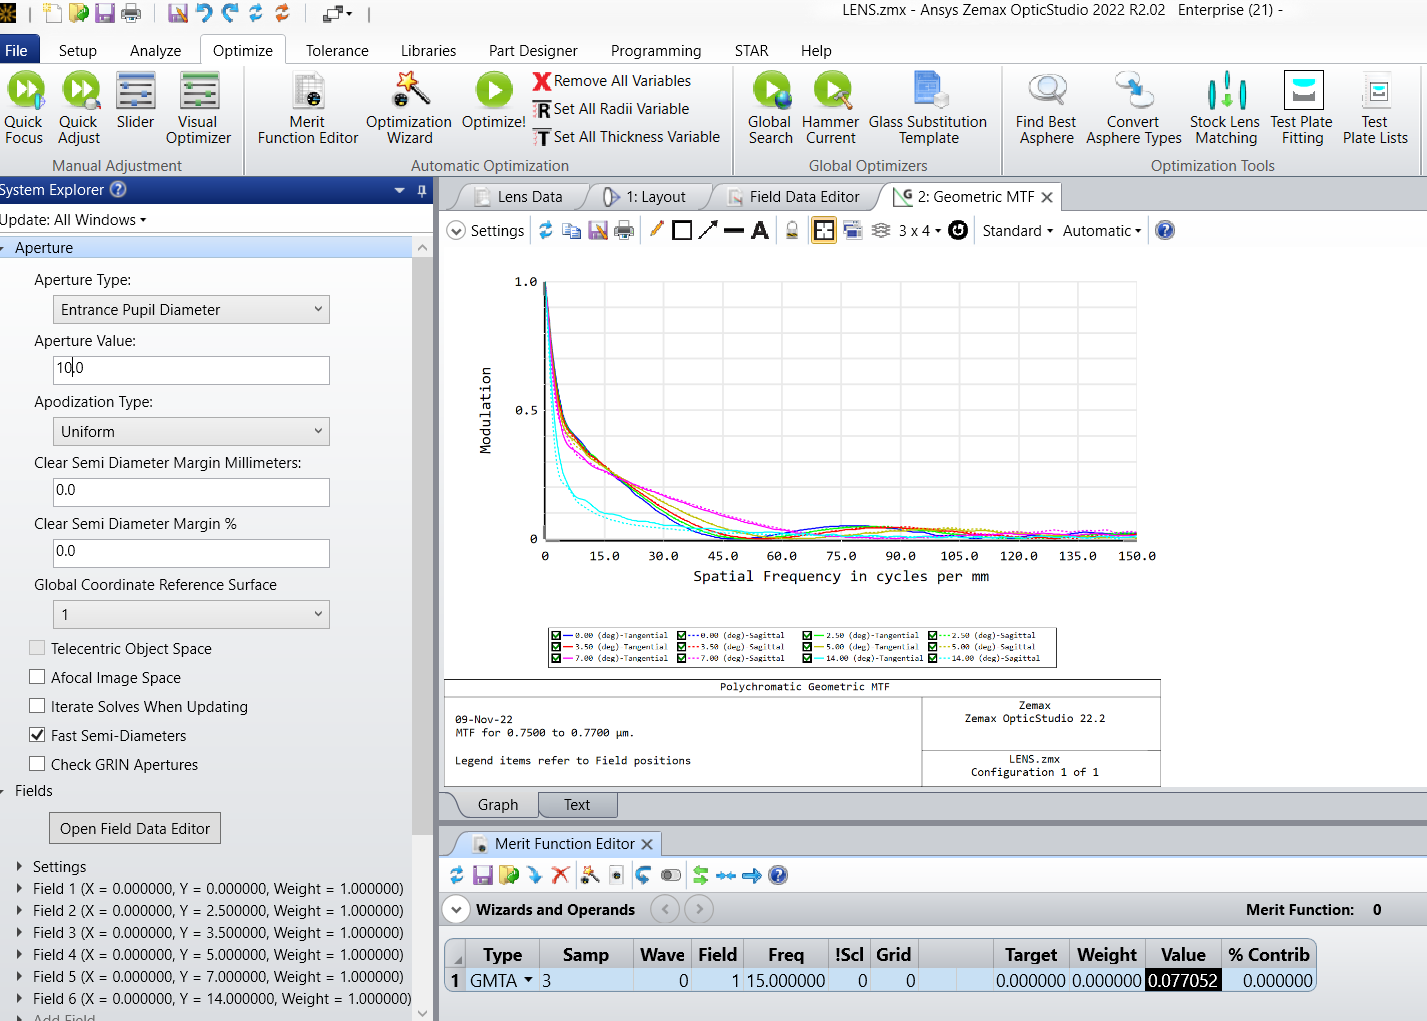
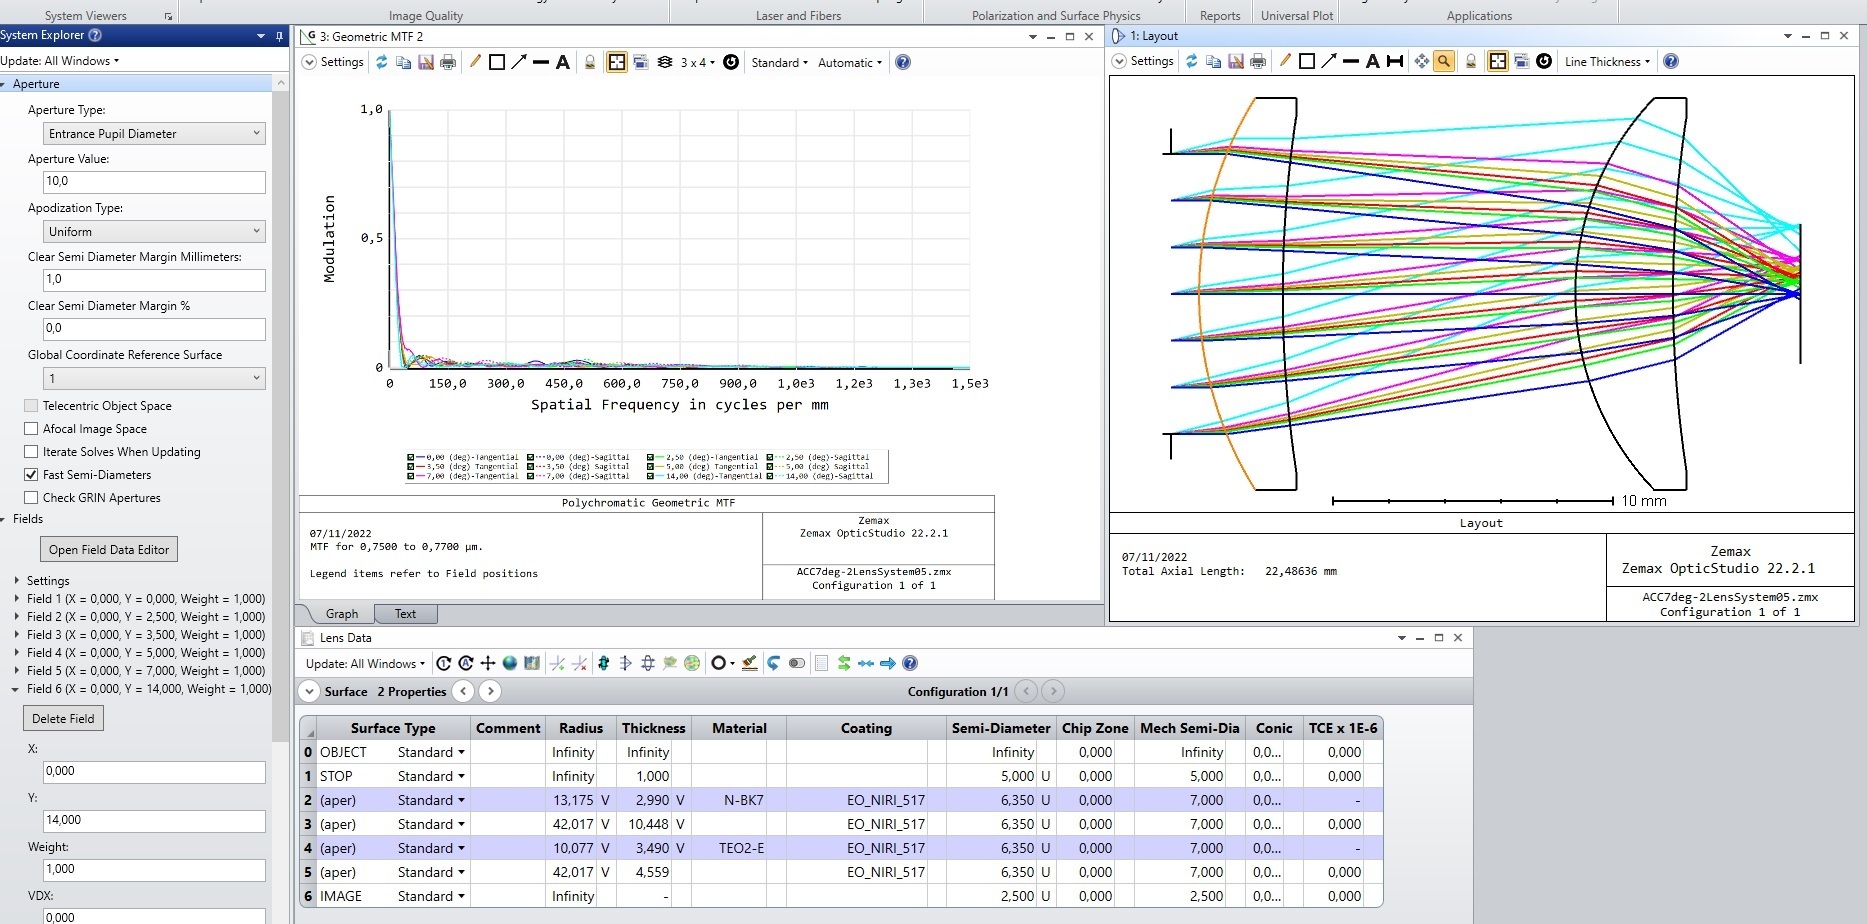
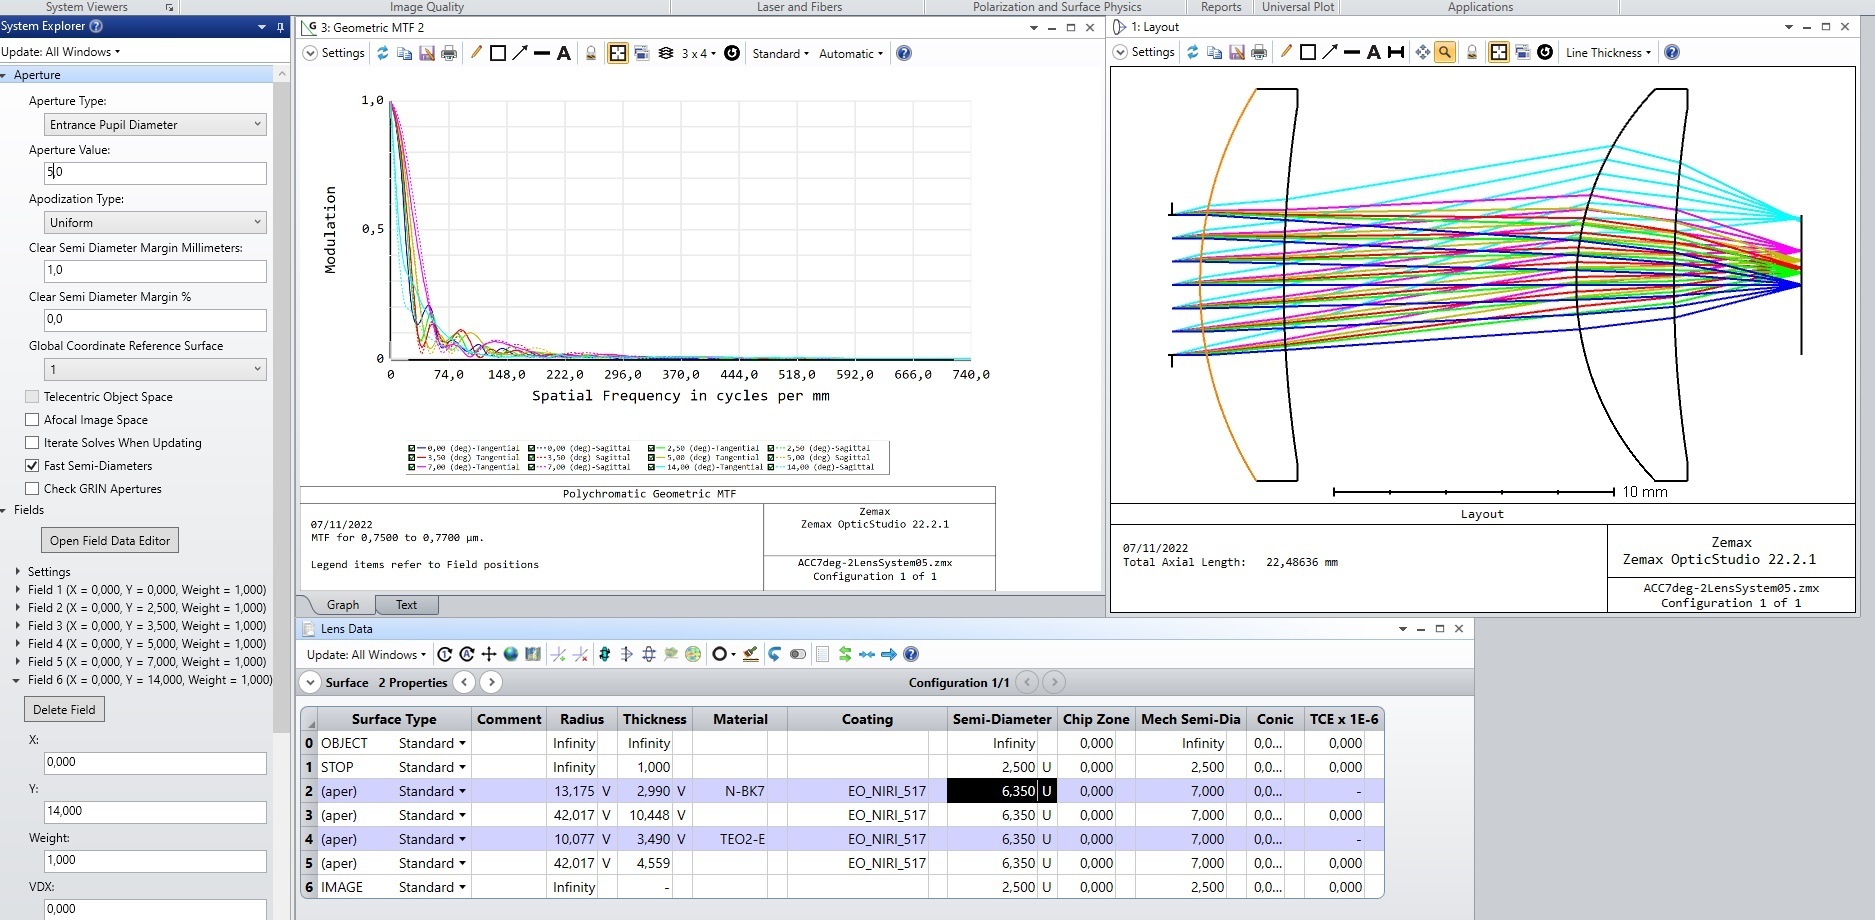
I designed an optical system and I wanted to compare Geometric MTF of 2 different Entrance Pupil Diameter (5 mm and 10 mm). I opened the window and saw the MTF. And I realized that MTF of EPD 10 mm is better than MTF of EPD 5 mm. However, the 2D plot of EPD 5 mm better than 2D plot of EPD 10 mm. Anyone can me explain it? I can’t understand why MTF with EPD 10 mm better that MTF with EPD 5 mm. I thought, it should be contrary.
 

Dear Martin,

I’ve re-created the system based on your screenshots. I’ve also set an arbitrary maximum frequency value so that the scales of both graphs are identical.
 

I then get MTF values that are better with the smaller entrance pupil diameter:


which also seems to be the case in the screenshots you shared, simply less obvious since the scale is different.

I’ve also added the results from the GTMA operand, and it shows the same kind of results.
Could you maybe elaborate on the steps you took to find opposite results? 

Thanks!

Dear Christophe,


thank you for your answer! Yes, you are right. I just made a misstake and understand my graphics wrong.


Best regards,

Martin


Reply