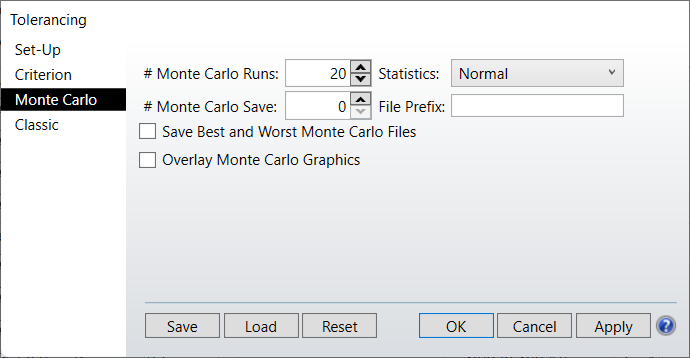
When performing tolerancing on a system, ín particular a Monte Carlo analysis, the report provides a list of the criterium value (e.g. RMS spot radius) for each iteration. Recently ive come across a different type of analysis, where the full MTF function (for all defined fields) is drawn for each iteration, like in the figure below:
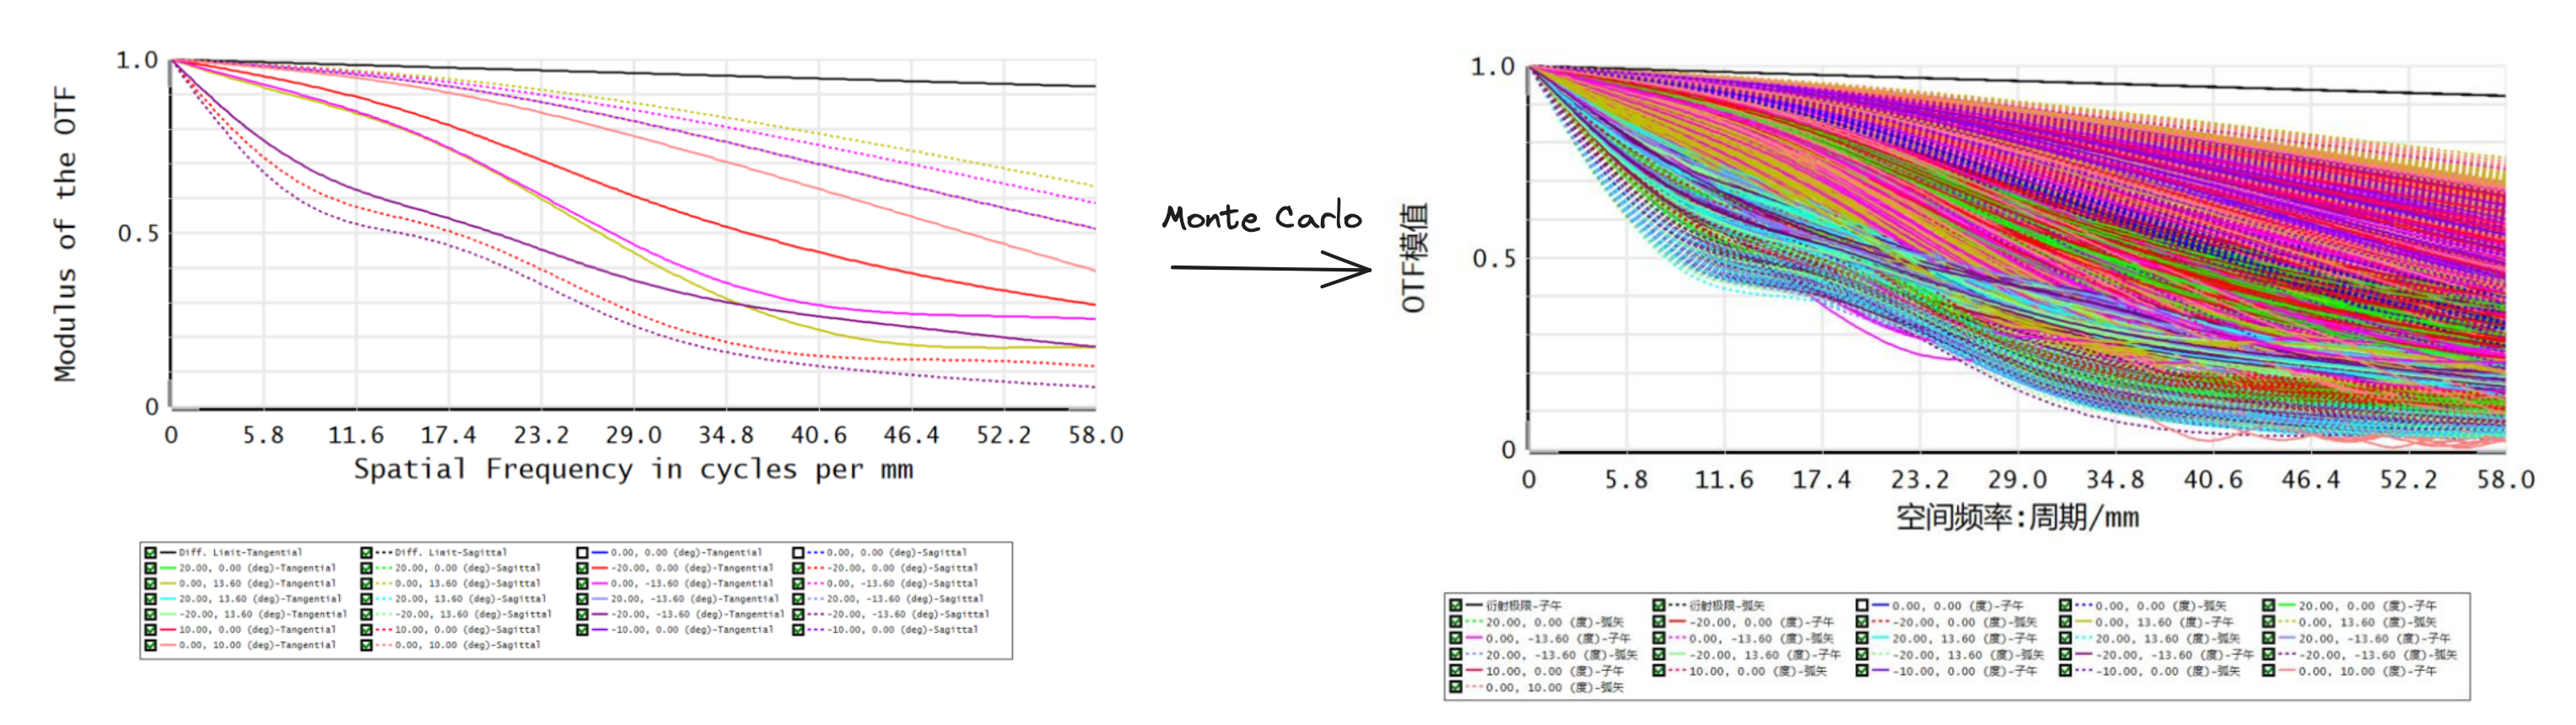
Can you elucidate how to execute this analysis?
Kind regards