Modeling LED light distribution

  • 4 February 2021
  • 5 replies
  • 893 views

Hi, 


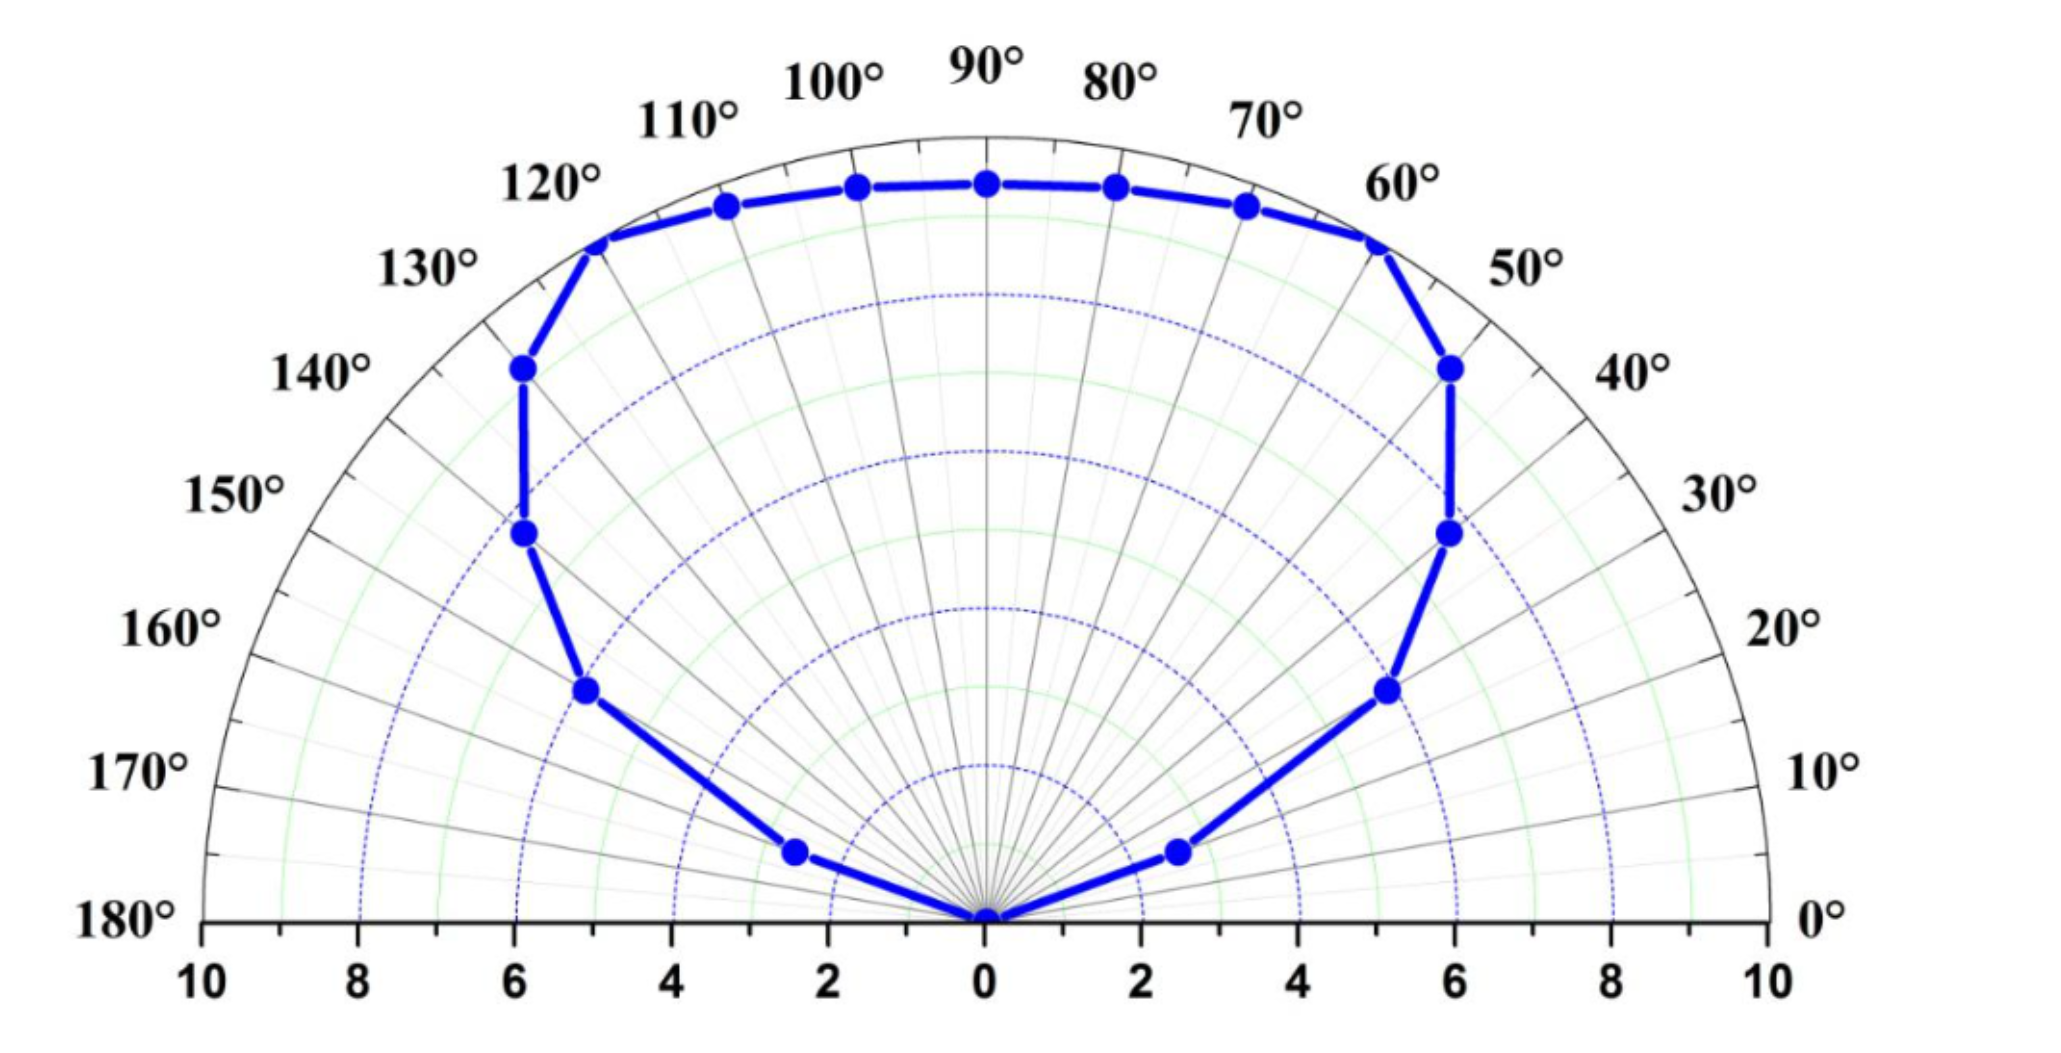
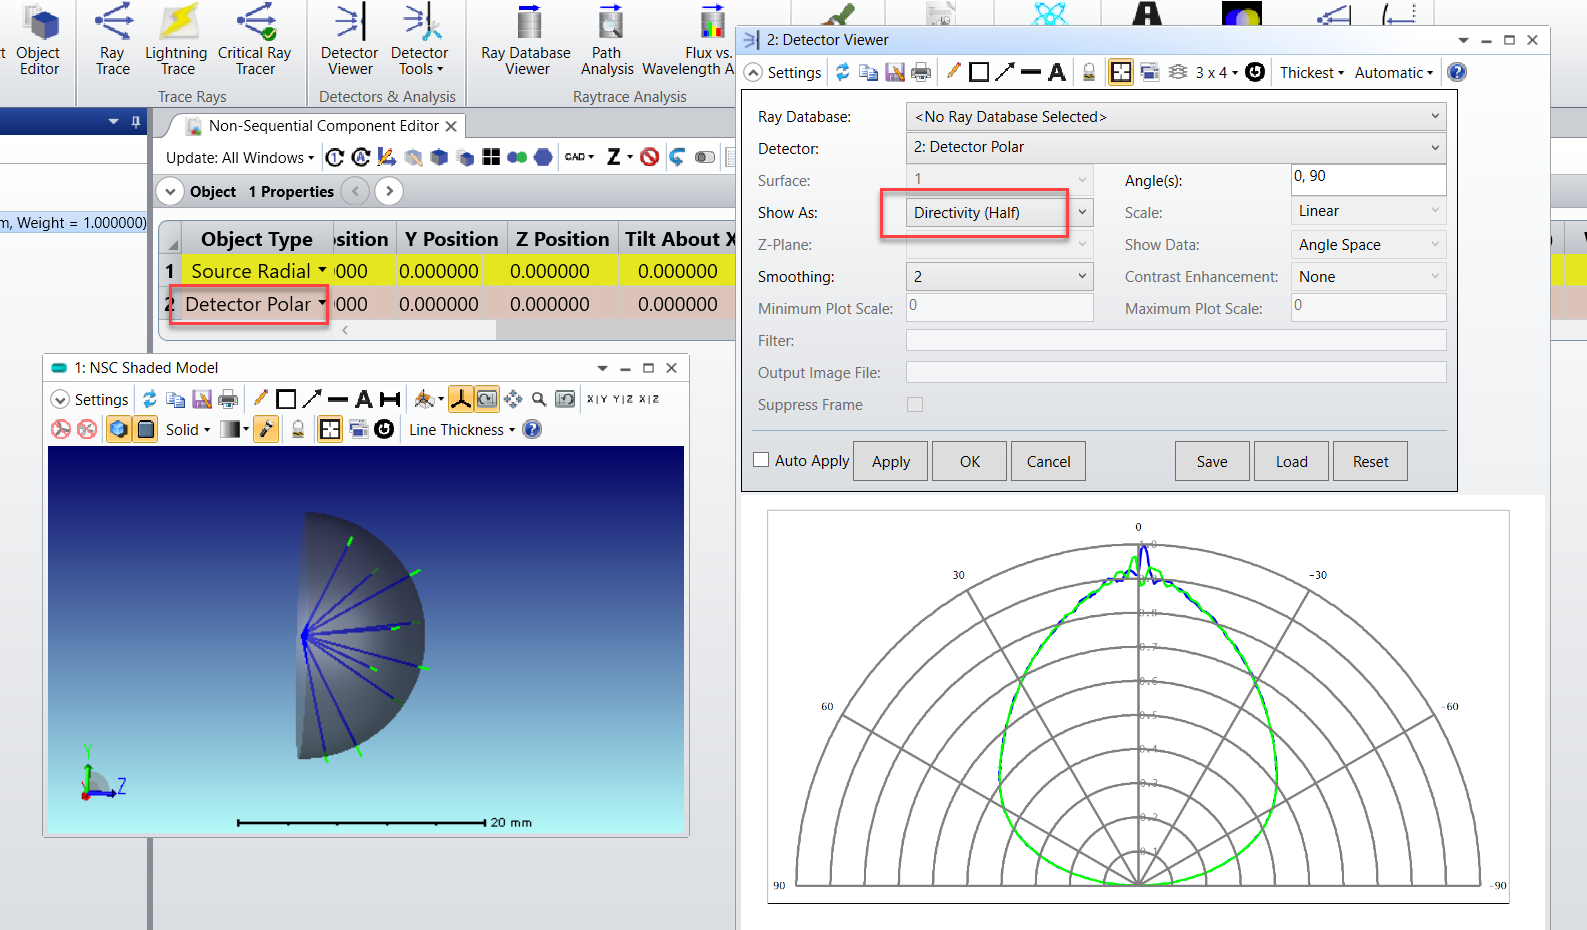
We exclusively deal with UV sources (250-270 nm range) that have directivity plots. The PDF help file mentions (pg 1897) for wavelengths outside the photopic response of the eye, luminance is zero. Is there a way I can define LEDs as a function of view angle and intensity for wavelengths below visible spectrum? 


5 replies

Userlevel 4
Badge +1

Hi Prabesh,


Thank you for your post!


When the wavelength is outside the visible range, the eye response curve drops to zero so it's not suitable to use photometric units such as Luminance. In this case you can still define the source using radiometric units, for example radiance or intensity. 


To define an LED where the intensity is a funciton of the angle, you can use Source Radial to model it. The Source Radial is a flat, rectangular or elliptical shape that emits rays into a hemisphere. The distribution of the rays in this hemisphere is symmetric about the local z axis and is defined by a cubic spline fit to arbitrary intensity vs. angle data. This intensity vs angle data you can obtain from the given LED directivity plot. 


You can find the Source Radial explained in the Help File at The Setup Tab > Editors Group (Setup Tab) > Non-sequential Component Editor > Non-sequential Sources > Source Radial.


Let us know if you have any other questions. 


Best regards,


Hui

Hi Hui,


Thank you for your reply and thank you for the detailed email in response to my inquiry on Monday. I was able to construct a Source Radial, but have a few more questions:


The source I am using gives intensity between angles 0 and 180. The intensity is not exactly the same between 0-90 and 90-180 degrees. However, it seems like with Source Radial, I can only use values from 0 to 90 degrees. I am reviewing this article, and I cannot get the detector view to show the radial intensity of the LED. Can you please help? 

screenshot2021-02-04084715.png
Userlevel 4
Badge +1

Hi Prabesh,


The Source Radial provides a ray distribution that is symmetric about the local z axis, therefore it only takes input angle for intensity from 0 to 90 degrees. If your source distribution has signifcant variation between 0 to +90 and 0 to -90, then Source Radial may not work for you. If that's the case, you might need to make your own source dll to accurately model this source distribution. You can find some discussions on how to create your own source dll in the help file at The Setup Tab > Editors Group (Setup Tab) > Non-sequential Component Editor > Non-sequential Sources > Source DLL.


As for viewing the directivity plot of a source, you need to use Detector Polar. Under Detector Viewer\Settings, you need to choose 'Show As: Directivity'


Best regards,


Hui

Hui, thank you so much. This is super helpful.

Userlevel 1

Hi Hui, Thanks for the suggestion, I was looking for the polar graph last few days. It helps. if I have angular data which is same for both +ve and -ve direction, will source radial consider my angular data in the negative direction also if I give positive data alone in LDE.

Regards

Ebinesh

Reply