Solved

Laser Diode Astigmatism


Badge

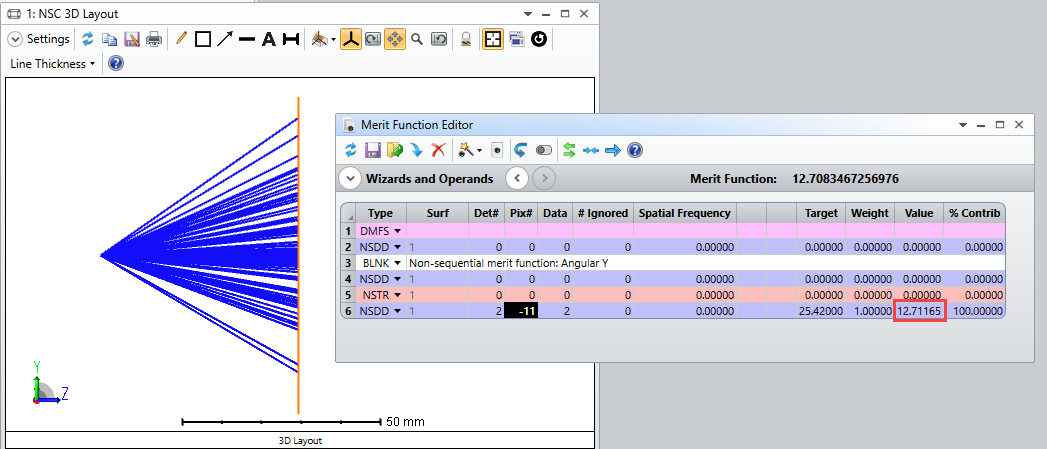
For modelling laser diodes via 'source diode' the value of astigmatism matters. Data sheet of laser diodes typically don't show this value.

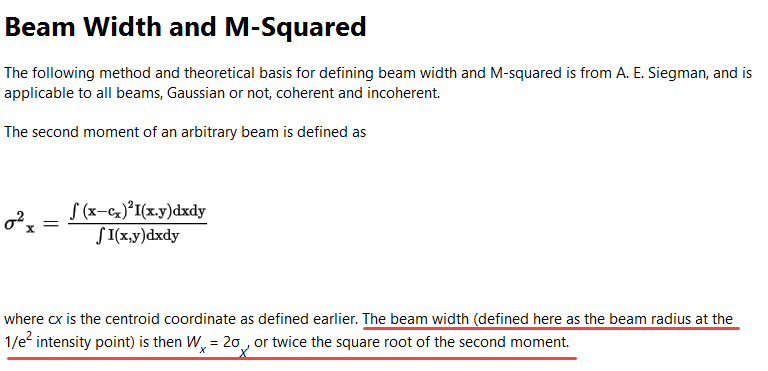
I tried to derive this value from far field beam divergence in the slow axis plane. Slow-axis divergence @1/e2 points is typically slightly bigger than the FWHM value. Using far field divergence equation one derives the beam waist and using the beam diameter-as-a-function-of-distance 'z' equation one can back calculate the 'z' necessary to get the beam diameter equal to the emitting chip length (not cavity length) e.g. 50µm..


I am not sure if this is correct. Any other suggestion/experience would be welcome.


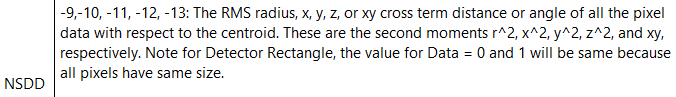
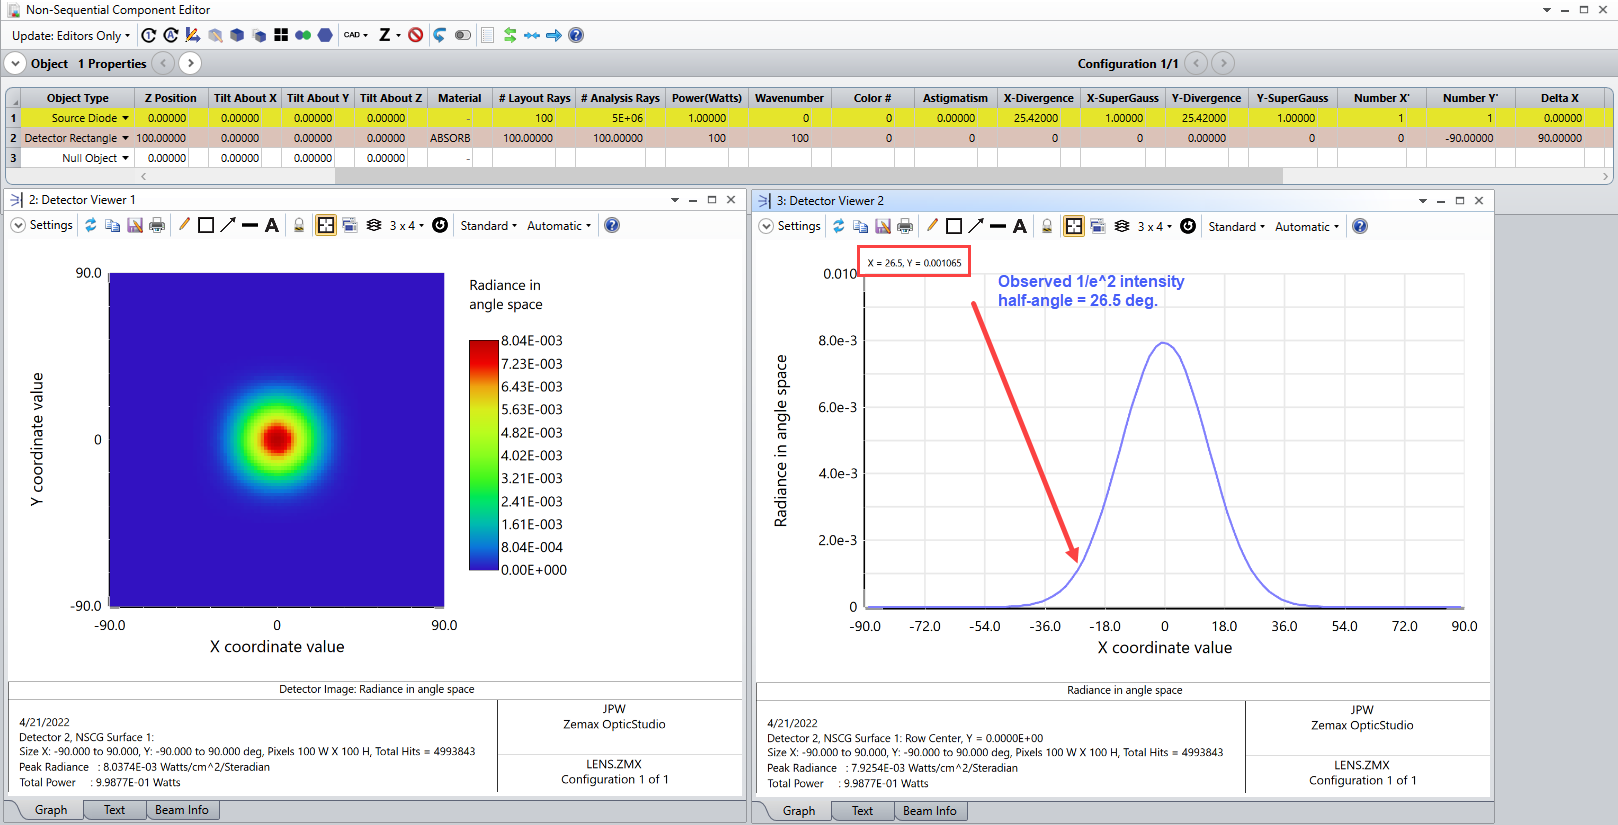
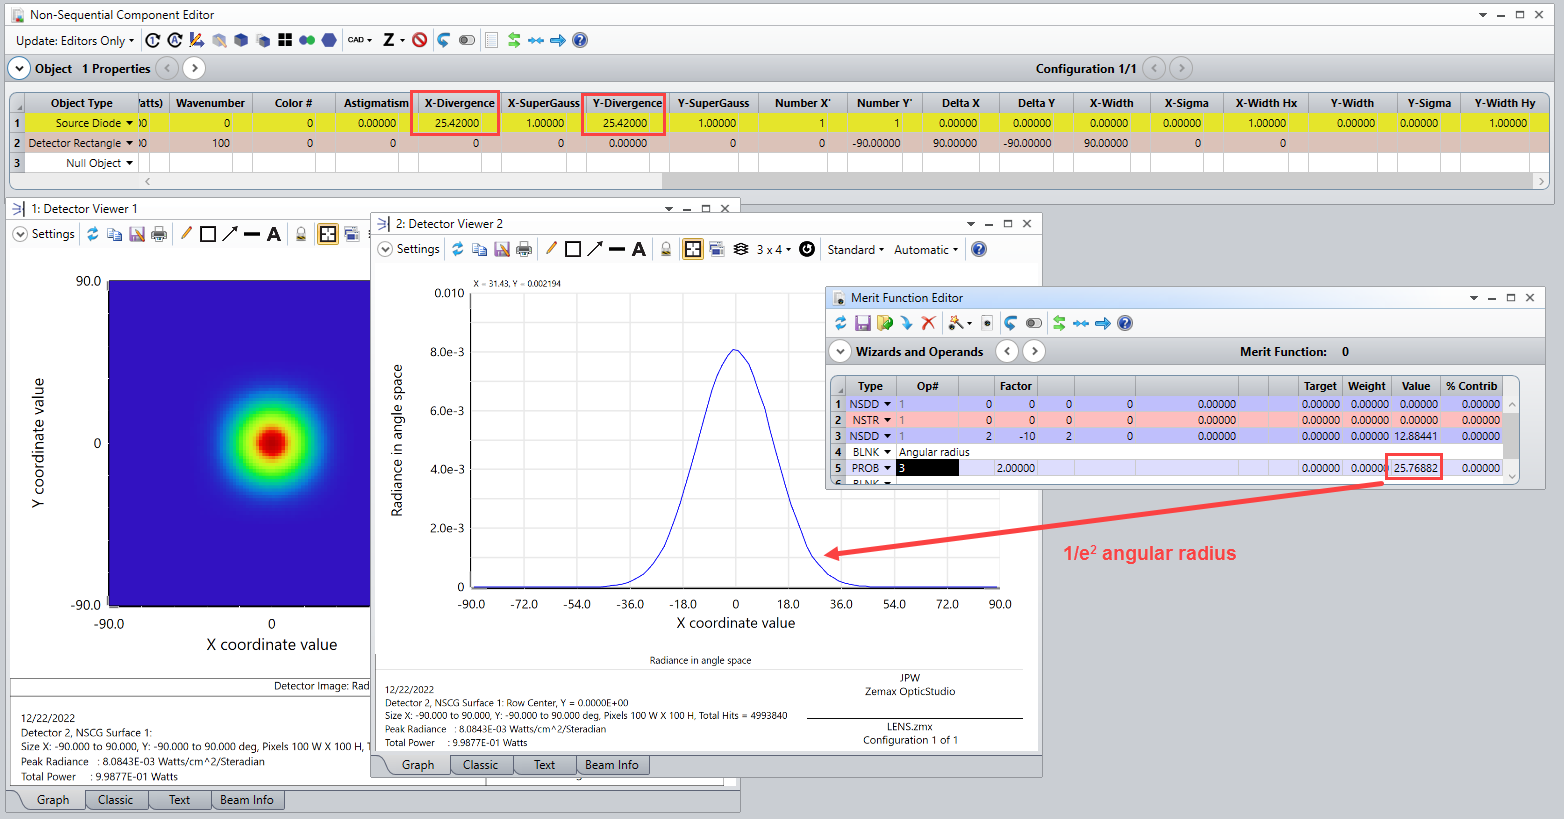
I was also never sure if the source diode inputs 'X-divergence' and 'Y-divergence' (in fact 0.85 x FWHM values) refer to full angle or half-angle.


Thanks, Dusan

icon

Best answer by Jeff.Wilde 25 April 2022, 23:06

View original

18 replies

Userlevel 6
Badge +2

Hi Dusan


Sorry for not commenting your forum post earlier but your approach of calculating the waist position seems reasonable to me.

The angles for the Source Diode are half-angles. 


We had a discussion with another user about the Source Diode (Source Diode with circular aperture) and he ended up writing a modified version of another user's DLL. He is happy to share it if you are interested. And regarding the forum thread that I mentioned, please note that the help files have been updated for the Source Diode in 21.2.


Sandrine


Hi Sandarine,

Why do zemax divide the divergence input by 2 . For example I have input the half-angle  divergence to be 25.424 degree ,but when I measured the spot x angular radius I fount it half  the value I have put into input.

Khallaf 

Userlevel 7
Badge +3

@Khaled Khallaf   I took a quick look at the Source Diode using a 25.42-degree divergence angle and don’t see a factor of two difference.


Using a Detector Rectangle to plot the angular distribution, I only see a slight discrepancy of about a degree or so.  How are you measuring the beam angle?

Hello jeff,

thanks alot for your reply!!

I measure the divergence indirectly through the optimization wizard by choosing to optimize spot Y angular radius to any value and after that I click apply thrn ok I open the merit function window and refresh the vlue to see the current value for the spot y angular radius . I find it 12.7 degree somehow which is a little bit weird.

Also I have a question . Do the detector rectangle angular distribution measure the full angle or half-angle divergrnce?

yours

khaled khallaf

Userlevel 7
Badge +3

Hi Khaled,

Ok, now I think I understand what you are doing.  In non-sequential mode, the NSDD merit function operand can report beam sizes (both spatial and angular) as found with the Detector Rectangle.  In your case, the Pix# = -11 and Data = 2 settings select the RMS Angular Y option. 


Note that the RMS angle value is *not* the same as the Gaussian divergence angle. 


In fact, for a Gaussian beam, the x and y RMS widths should be equal to one-half the 1/e^2 values, which is what you are seeing:


Regards,

Jeff

Hello Jeff,

Thanks a lot for your immense help!!

how did you make it a perfect gaussian beam? I made the Gx and Gy equal to 1 but it is not perfect gaussian

yours,

Khaled

Userlevel 7
Badge +3

Hi Khaled,

The beam comprises a random set of rays with angles drawn from a 2D Gaussian probability density function.  Therefore, the beam will always have some random ray-variation characteristics.  If you want to observe a smoother version, then try using fewer detector pixels (say 100 x 100) and more rays (say 5e06) -- see the beam profile example in my post from five days ago.

Regards,

Jeff 

Thanks a lot Doctor!!

I had also another question . IS the RMS spatial radius is also equal to half the gaussian beam radius?

Yours Khaled,

Userlevel 7
Badge +3

Hi Khaled,

The answer is theoretically yes.  It’s a property of Gaussian power distributions, whether in the spatial domain or angular domain.

However, for the angular distribution, due to the specific implementation of the source diode in OpticStudio, there will be a slight discrepancy between the two values that grows as the angular spread of the Gaussian becomes larger.  As explained in the help documentation:


For example, when the Gaussian beam has a 1/e^2 angular radius of 45 degrees, the reported RMS angular radius is approximately 23.3 degrees (i.e., slightly larger than 45/2).


Regards,

Jeff


Thanks alot doctor for your help!!


@Khaled Khallaf   I took a quick look at the Source Diode using a 25.42-degree divergence angle and don’t see a factor of two difference.


Using a Detector Rectangle to plot the angular distribution, I only see a slight discrepancy of about a degree or so.  How are you measuring the beam angle?

Dear Jeff,

Thank you for showing the example! I would like to ask the following question: 1) Is there a way to export the cross-section far field data (like the one you show above) to txt or csv file? 2) Is there any operand that extract the far field divergence? I want to do programming so that I can have dependence of far field divergence on the input source diode divergence. 3) I assume that you ignore the spatial distribution (near field) of the source diode. Will the current result be affected if I filled out those fields of spatial distribution (well, not by arbitrary data because near field and far field are somewhat associated, I mean I have both near field and far field data of our real laser diode)? 4) I tried to increase the x- and y- pixel numbers. However, to the contrary of my expectation (to get smoother curves), I see noisier  results (like on top of your result shown above there are some fluctuations). So how do you interpret this phenomenon and do you have any advice on selecting numbers of x- and y- pixels? Looking forward to your reply!

Regards,

Jiang

Userlevel 7
Badge +3

Hi Jiang,

  1. Yes, you can cut-and-paste the raw data from the “Text” tab at the bottom of the graph window.  The data can also be extracted programmatically via the ZOS-API.
  2. In non-sequential mode, the NSDD operand provides parameters for computing the radius of the beam profile (in both the spatial and angular domains).  Note this issue was already discussed previously as part of this topic (see above).  However, just to be clear, I’ve repeated the answer below.
  3. Yes, I ignored the spatial size of the source spot because the previous user didn’t provide it, but also it’s not needed for the far field.  After a sufficiently long propagation distance, the size of the beam is much larger than the original source spot size, so the near-field spot size doesn’t affect the the far-field result.
  4. If the detector data become more noisy as the pixel size shrinks, then you most likely do not have enough rays striking a typical pixel.  The SNR is roughly equal to the square root of the average number of rays per pixel (in the illumination region).  Typically you want ~100 (or more) rays per pixel on average.  So, you need to increase the number of analysis rays accordingly.

Angular Radius of the Beam in the Far Field

Here is what the help documentation says:


Also, beam radii values can be found in the “Beam Info” tab of the Detector Viewer:


But this only applies to the spatial beam profile (not the angular profile).

Regards,

Jeff

Hi Jiang,

  1. Yes, you can cut-and-paste the raw data from the “Text” tab at the bottom of the graph window.  The data can also be extracted programmatically via the ZOS-API.
  2. In non-sequential mode, the NSDD operand provides parameters for computing the radius of the beam profile (in both the spatial and angular domains).  Note this issue was already discussed previously as part of this topic (see above).  However, just to be clear, I’ve repeated the answer below.
  3. Yes, I ignored the spatial size of the source spot because the previous user didn’t provide it, but also it’s not needed for the far field.  After a sufficiently long propagation distance, the size of the beam is much larger than the original source spot size, so the near-field spot size doesn’t affect the the far-field result.
  4. If the detector data become more noisy as the pixel size shrinks, then you most likely do not have enough rays striking a typical pixel.  The SNR is roughly equal to the square root of the average number of rays per pixel (in the illumination region).  Typically you want ~100 (or more) rays per pixel on average.  So, you need to increase the number of analysis rays accordingly.

Angular Radius of the Beam in the Far Field

Here is what the help documentation says:


Also, beam radii values can be found in the “Beam Info” tab of the Detector Viewer:


But this only applies to the spatial beam profile (not the angular profile).


Regards,

Jeff

Dear Jeff,

Thank you for your detailed information! Your answers are always well-organized, clearly corresponding to questions, and helpful for further thoughts, as I can see under other topics:) Now I have the following questions based on your reply quoted above:

  1. In the “Beam Info” tab how accurate is the “RMS spot X”? I tried to see the 1/e2 value from the Detector View (with your editor settings shown above, and “Show As” - “Cross Section Row”, “Show Data” - “Radiance(Position)”) and I obtained 1/e2 value ~ 43.8, which is way smaller than twice of ~23.99. I also tried to correlate it to 1/e2 in angular space: 2*arctan(23.99/100) = 26.98, which is larger than 25.77 (form your MFE estimate) by more than 1 degree. It seems to me that the “RMS Spot X” value in the “Beam Info” tab is overestimated. Or could you please point out what I did wrong in my two estimates here?
  2. For my own project the method that you showed in the Merit Function Editor will be more helpful (so that I can reproduce it in ZPL macro right away). The question is again accuracy. Can I say that under your configuration (Analysis Rays 5E6, detector distance 100mm, 100x100 half width, 100x100 pixels) 25.77-25.42 = 0.35 degree will be the MAXIMUM error for any divergence angles up to 25.42 degree? Moreover, is it true that one can increase this accuracy by launching more rays and shrinking the detector pixels?

Regards,

Jiang

Userlevel 7
Badge +3

Hi Jiang,

Here are my responses:

  1. The RMS Spot X value should be quite accurate.  In general, you can always increase the number of pixels and rays to see if the value changes very much -- but there’s no need to over-sample unless it actually makes a difference.  If you want to compare the RMS result to the cross section graph, be sure to use an odd number of pixels so that the cross section actually goes through the center of the beam profile.  In the example above, with 100 x 100 pixels, the central cross sections in x and y are slightly offset from center, which causes the discrepancy you see.  Just change the number of pixels to 101 x 101 and you should see good agreement.
  2. Regarding the angular radius, I think there is an intrinsic error in OpticStudio between the X- and Y-Divergence angles used to define the Source Diode compared to the corresponding angular RMS values reported in the MFE based on the detector data.  This is what the help documentation says:


I ran a quick test to see how the detector-based RMS values compare to the X-Divergence angles over a range of X-Divergence angles (note: a pick-up is used to simultaneously adjust the Y-Divergence angle).  Here is what I find for the percent error between the two:


You can see that for 1/e^2 beam radius angles up to 20 degrees, the error is < 1%, but it increases after that.  Since I don’t know how the internal code is written, I can’t say much more about the origin of this error.


However, assuming the error is repeatable, you might be able to simply apply a small fixed offset to a given X/Y-Divergence angle in order to yield a desired angular radius based on the actual ray distribution found using the detector RMS value.

Regards,

Jeff


Dear Jeff,


Thank you for your response! May I ask how did you generate the plot shown above? I couldn’t reproduce it. See my settings below.


The ZPL macro:
source = 1 # Source number
detector = 2 # Detector number
z_pos = 100.0 # Detectot z position
# Update detector z position
SETNSCPOSITION 1, detector, 3, z_pos

min = 5
max = 40
data_points = 8
step = (max-min)/(data_points-1)
DECLARE x, DOUBLE, 1, data_points
DECLARE widthSA, DOUBLE, 1, data_points
DECLARE errorSA, DOUBLE, 1, data_points

log_filename$ = "C:\Users\-\Desktop\LFFwidth_error_Jeff2.txt"
OUTPUT log_filename$

! Scan X-Divergence of the source diode
i = 0
FOR tx, min, max, step
    # Update source diode X-Divergence
    SetNSCParameter 1, source, 7, tx
    SetNSCParameter 1, source, 9, tx
    
    # Clear detectors
    clear = NSDD(1, 0, 0, 0)
    
    # Raytrace
    NSTR 1, 0, 0, 0, 0, 1, 0
    
    i = i+1

    x(i) = tx
    # Get the 1/e2 with in angular space

    widthSA(i) = 2*NSDD(1, detector, -10, 2)

    errorSA(i) = (widthSA(i)-tx)/tx*100
    
    PRINT x(i), " ", widthSA(i), " ", errorSA(i)
NEXT

t = ETIM()
PRINT "Elapsed time was ",t," seconds."
PRINT "To reproduce Jeff's result. z=100mm"

# Plot the data
PLOT NEW
PLOT TITLEX, "X-Divergence (degree)"
PLOT TITLEY, "Angular Error using RMS Result (%)"
PLOT FORMATX, "%2.1f"
PLOT FORMATY, "%2.1f"
PLOT DATA, x, errorSA, data_points, 1, 0, 0
PLOT GO

RELEASE x
RELEASE widthSA
RELEASE errorSA


Regards,

Jiang

Dear Jeff,


I tried to do a fine scan (step = 1 degree) and I got the following plot. @Jeff.Wilde For slow axis (X-direction) of commercialized near infrared multimode laser diodes the X-Divergence is just a few degrees, and I saw in this region the error is huge according to my plot. So I am really interested in reproducing your error plot before robustness test (I will try to plot error fluctuation against, say, 100 runs) and compensating the error. By the way, it seems like the results depend of z-position as well, not sure about dependence on the spatial parameters of source diode (it shouldn’t like you mentioned before but I didn’t verify yet), #Analysis rays, or #Detector pixels.

Regards,

Jiang

Userlevel 7
Badge +3

Hi Jiang,

I used the Universal Plot feature to generate the RMS radius while scanning the X-Divergence angle and recording the RMS x-radius from the MFE, and then copied the data to Matlab for analysis and plotting.  The X- and Y-Divergence angles were scanned together by using a pick-up on the Y-Divergence to replicate the X-Divergence angle. 

You probably need to increase the physical size of the detector to make sure you capture the wings of the Gaussian at the largest angles.  For the smaller angles, you need enough pixels to properly sample the beam. 

Here’s what I get when using a 500 mm x 500 mm detector with 2001 x 2001 pixels. 


Regards,

Jeff

Hi Jiang,

I used the Universal Plot feature to generate the RMS radius while scanning the X-Divergence angle and recording the RMS x-radius from the MFE, and then copied the data to Matlab for analysis and plotting.  The X- and Y-Divergence angles were scanned together by using a pick-up on the Y-Divergence to replicate the X-Divergence angle. 

You probably need to adjust the physical size of the detector to make sure you capture the wings of the Gaussian at the largest angles.  For the smaller angles, you need enough pixels to properly sample the beam. 

Here’s what I get when using a 500 mm x 500 mm detector with 2001 x 2001 pixels. 


Regards,

Jeff

Dear Jeff,

What a coincidence! I just realized the detector pixel issue and wanted to let you know…

Thank you very much for your reply and I apologize for my sloppy thinking…

Regards,

Jiang

Reply