Solved

How Zemax computes Best Fit Sphere?


Userlevel 2

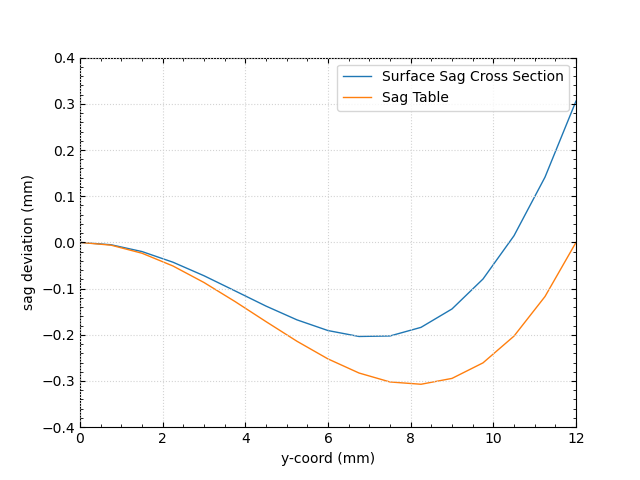
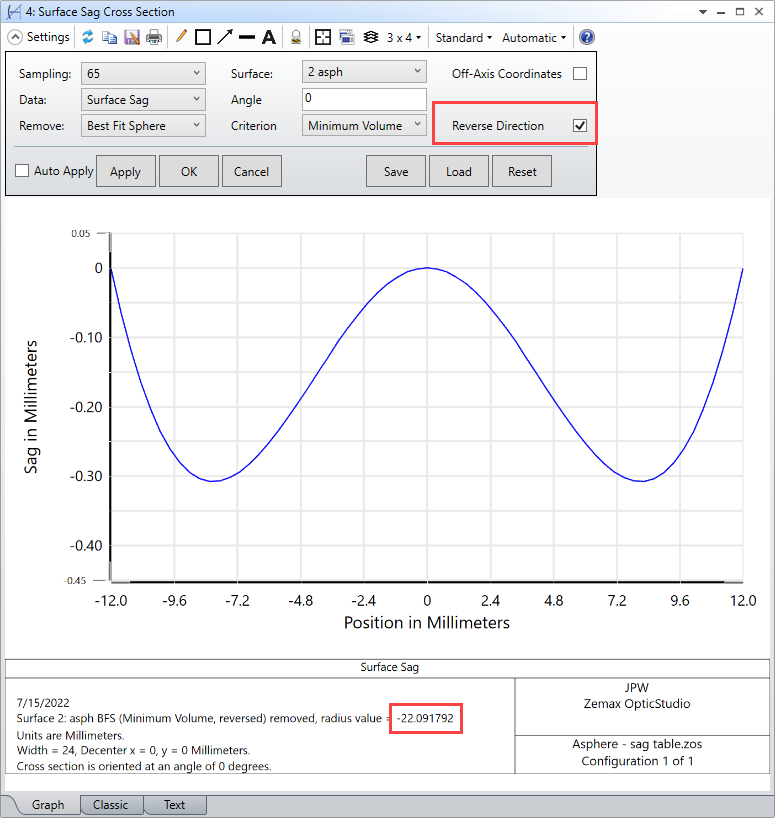
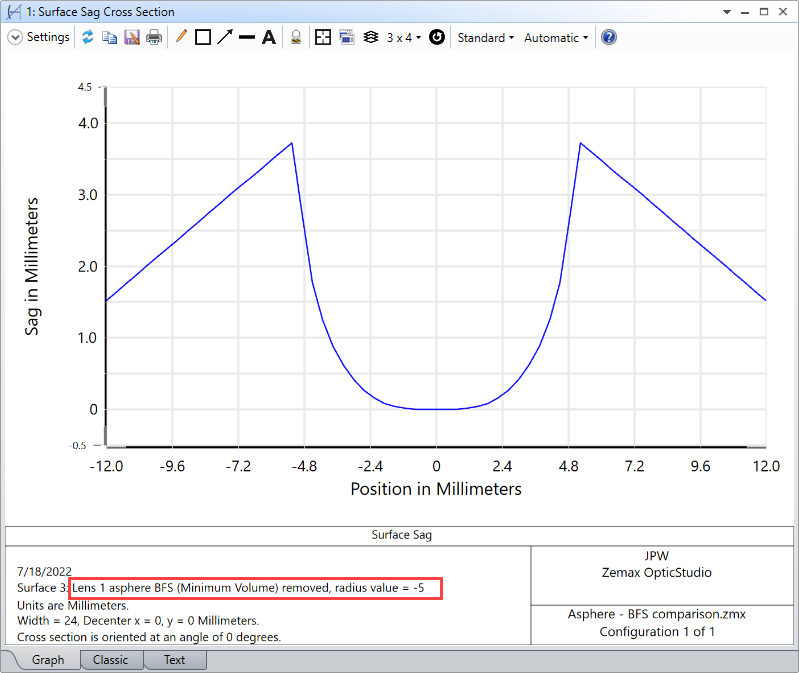
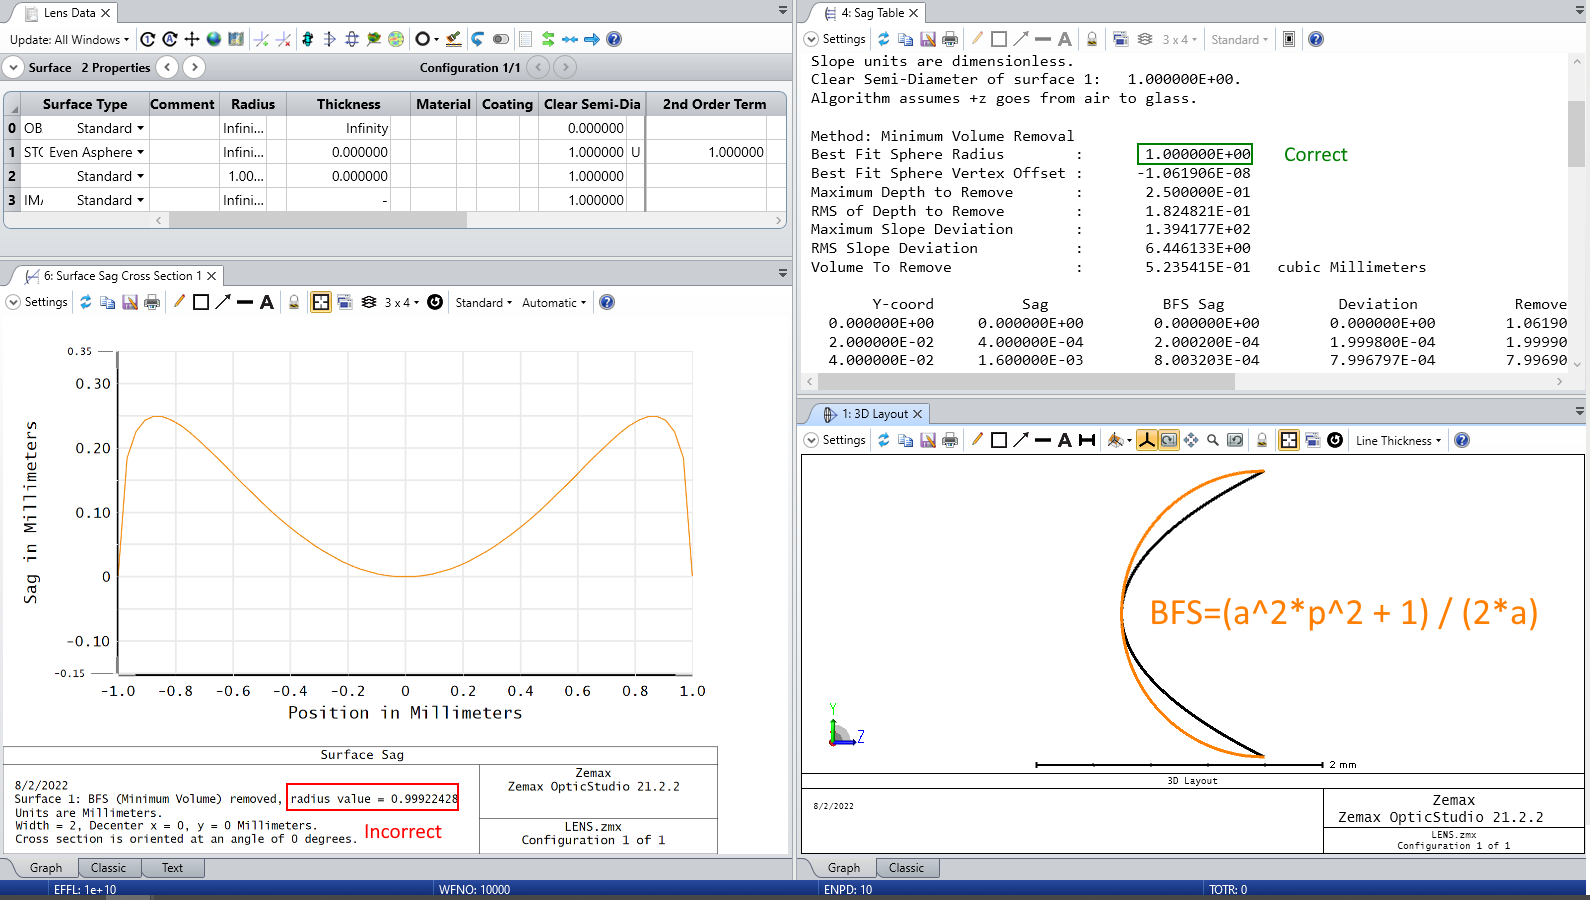
I was trying to find a way to plot with OpticStudio the “Remove” column of the “Sag Table” feature. I went straight to the “Surface Sag Cross Section” feature and selected “Remove: Best Fit Sphere”. In both cases the BFS fitting Criterion was kept to “Minimum Volume”.

Unfortunately I’m realizing that the calculate BFS radius is not the same for the two cases and, therefore, the BFS sag offset changes accordingly.

I might be doing something wrong. Please, see the attached sample file.

icon

Best answer by Hui Chen 11 August 2022, 03:11

View original

12 replies

Hi Alberto,

I have question regarding Sag Table.

Do you know how sag table has calculated slope value? 

Userlevel 2

After further analysis I can just add that the MF operand DSAG gives the same results as the “Surface Sag Cross Section” feature.

Still, I cannot explain the difference between the two features:

BFS radius of curvature
from “Surface Sag Cross Section”: -20.626616mm
from “Sag Table”: -22.08801mm


Userlevel 7
Badge +3

For the Surface Sag Cross Section try using the “Reverse Direction” option:


The result is not exactly the same as the Sag Table case, but it’s very close.

Userlevel 2

Hello Jeff, thanks for the advice. Your approach does work.

Nevertheless, I would also like to get some insight about how the BFS radii are computed by the two features and why they do not match exactly. 
For example, if I tick “Reverse Direction” in the “Sag Table” feature I get another different value:

BFS radius direct reverse
Sag Table -22.08801 -22.90040
Surface Sag Cross Section -20.626616 -22.091792

I highlighted in yellow the similar values.

Moreover, to my understanding, the sag offset should be always of the same sign when “Minimum Volume” is selected as Criterion. I guess this because this criterion makes sense with asphere manufacturing process in mind (material removal from BFS), but I may be wrong.

Sign is maintained for the “Sag Table” feature, but does not for the “Surface Sag Cross Section” feature, where the graph goes above and below the zero line.

Thanks again for your support.

Userlevel 7
Badge +3

Hi Alberto,

You raise a good point, so out of curiosity I spent a bit more time looking into this problem. 

First, it looks like using the BFS Minimum Volume option within the Sag Table works properly.  I created a somewhat more general example by using a more aspherical axicon-like surface, and then used this surface for both a glass-to-air transition (defined in the direction of ray propagation) as well as a “reversed” air-to-glass version.  Note that in this context, selecting the “Reversed Direction” option for the BFS fit simply swaps the media around, it doesn’t flip the surface itself.  The model is attached, but here is an annotated screen shot:


In both cases, the fitting algorithm automatically selected the correct orientation for the aspherical surface (i.e., I did *not* need to manually select the “Reverse Direction” option), and it provided “Remove” numbers (which correspond to the BFS surface sag minus the asperical surface sag) that are positive, meaning one could start with the BFS surface and machine or polish material away, shown above in red, to generate the desired aspherical surface.  This is consistent with what the help documentation says:


However, when I tried to perform BFS (Minimum Volume) subtraction using the Surface Sag (or Sag Cross Section) tool, the results were significantly different.  In this case, with my more aspherical surface, the BFS option defaulted to a spherical surface having the base radius of curvature.  The “Reverse Direction” option made no difference at all. 


This seems like a bug.  Perhaps someone from Zemax can comment.  If not, then in a few days I may submit a tech support ticket.

Apparently the Sag Table and the Surface Sag tools use different versions of the BFS fitting algorithm.  At this point I would only trust the Sag Table version.

Regards,

Jeff

Userlevel 2

Thank you @Jeff.Wilde for your insight on the issue. 

I already opened a Support Ticket on the 15th of July (Case Number 52610) which redirects to this forum page. By now they just answered that they confirm what we are seeing and also:

I'm not sure if this is a bug or if there is something amiss in the help file describing the computation. But either way, I would like our Developers to take a look at the case and give some clarification on why this difference exists. I will file this as a bug for our Developer to investigate further.

Userlevel 4
Badge

Hi Alberto,

Here is what I found, with some Matlab tests.

1- If you look at your Zemax layout, you will notice that the “sag table BFS” surface touches the original asphere at the edge. Note that in the text data, it says “Minimum Volume Removal”.

This is for machining, You want the sphere approximation to be always above the asphere, because you cannot put material back, only remove some. If you look at a circular profile that coincides with the asphere at the center and at the semi-diameter, there is only one and its radius of curvature is -22.088 (1 axis + 1 point define a unique circle).


2- If you ignore this constraint due to manufacturing and just want the closest sphere, you still can get 2 different mathematical values.

You can fit a 1 D profile H=f[r] and in that case, the best fit radius is -20.42, which you can obtain in the sag table with “Minimum RMS (no offset)”.

You can fit the 2D profile H=f(x,y) and in that case, the best fit radius is -20.63, which is what the Surface Sag Cross section returns. In a 2D geometry, there are way more points at the edge, so they get weighted higher than the ones close to the center.

Userlevel 4
Badge +1

Hi Ray,

Thank you for your post! This is an interesting catch. Similar to what Alberto and Jeff have pointed out, I also noticed the slight discrepancy in the BFS Radius reported between the Sag Table and the Sag Cross Section analyses when both choosing Minimum Volume Removal. I’ll confirm internally on why the treatment is different. Once that’s confirmed we could add a short discussion in the help file for clarification. 

Best

Hui

Userlevel 7
Badge +3

Hi Hui,

Can you also please look at the model I attached above?  It demonstrates an aspherical surface for which the BFS Min. Volume Removal option shows dramatically different results when using the Sag Table version (BFS radius = -27.6 mm) compared to the Sag Cross Section version (BFS radius = -5.0mm). 

Thanks,

Jeff

Userlevel 6
Badge +2

Hi Hui,

It looks like the Sag Table code is correct and the Surface Sag Cross Section is the problematic calculation.  If I simply look at an Even Asphere with only a r^2 component, the BFS sphere simply becomes:

BFS = (a^2*p^2 + 1) / (2*a)

Where a is the r^2 term and p is the Semi-Diameter.  Choosing some easy values of a=1.0 and p=1.0, you should get a BFS of exactly 1.0.  When you look at the Sag Table, you get exactly 1.0 but when you look at the Surface Sag Cross Section, you 0.99922428.  I would obviously look at both code paths but I would start with the Surface Sag Cross Section.


Userlevel 4
Badge +1

Hi all,

Just want to let you know I have filed this behavior as a bug for our Dev Team to investigate. I’ll keep you all posted here if I hear any updates. 

Thank you!

Badge +2

Hi Hui

Was there any updates from the Devs for the BFS?

I also faced the same issue where I got different BFS values for simple conic aspheres using either Sag Table and the surface Sag plots.

I mostly used the surface sag plots for analysis, which was also used in several of the online Zemax lessons. If the surface sag plots were found to be wrong as what could be suggested here, then it would be a fair bit of incorrect data I have.

Reply